

Quick answer: With PCOS and diagnosed diabetes, insulin resistance comes from two directions at once, and one of them moves with your menstrual cycle. The most useful thing to track is one repeated comparison: the same meal, logged the same way, in two different phases of your cycle. Everything else you log is there to make that comparison readable.
Most diabetes tracking advice assumes your body handles the same meal roughly the same way each time. With PCOS, you have probably noticed otherwise.
A lunch that sat flat two weeks ago can climb this week, with nothing about how you ate it changed. That is not you doing something wrong. It is a reason to log a few things well enough to compare them.
Why is glucose harder to predict with PCOS and diabetes?
Because two things are pushing on insulin sensitivity, and only one of them holds still.
PCOS is closely tied to insulin resistance, which is why women with PCOS get screened for type 2 diabetes over time. Add a diagnosis and that background resistance now sits underneath everything else you manage.
Insulin sensitivity can also shift across the menstrual cycle, and for some people that shows up as higher glucose in the second half. We covered the mechanism in why the same meal spikes differently by cycle phase.
The follicular phase is roughly the first half of your cycle, from the start of your period to ovulation. The luteal phase is the second half, ovulation until your next period starts. Those two words do a lot of work below, so they are worth pinning down now.
The evidence here is softer than most articles admit. A 2023 systematic review of studies in type 1 diabetes found the research inconclusive, with worsening luteal-phase insulin sensitivity showing up in a subset of people rather than in everyone. Other work using CGM data has found higher glucose around ovulation and the early luteal phase compared with the early follicular phase.
That matters if you have ever been handed a target and told the rest came down to consistency. The research cannot tell you whether a mid-cycle shift applies to you, and neither can anyone who has not seen your own log, which is the whole argument for keeping one.
What is the one comparison worth running first?
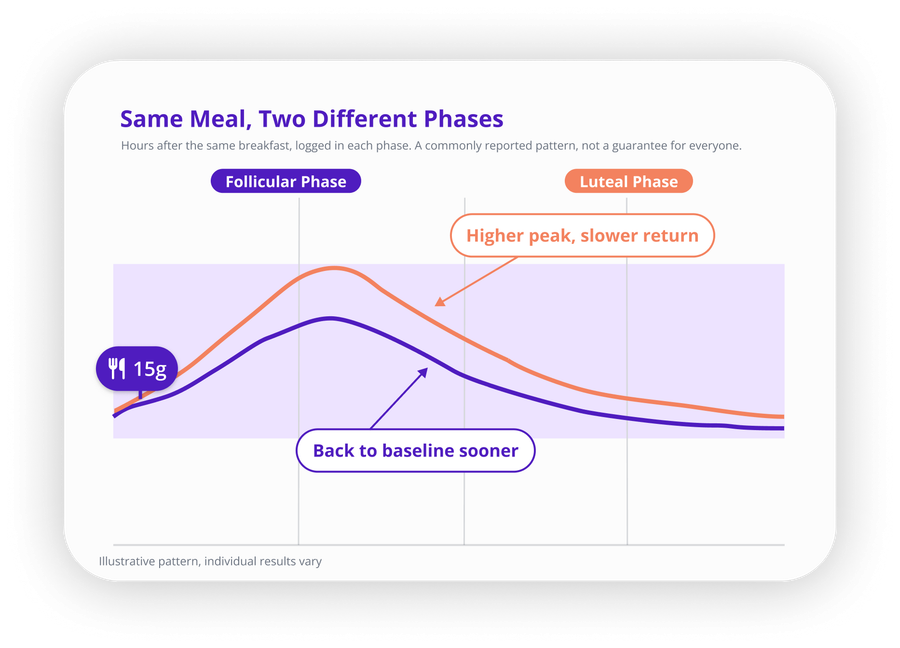
Take one meal you eat often. Log it the same way in your follicular phase, then again in your luteal phase. Compare the two curves.
Breakfast usually wins, because breakfast is the meal you eat half asleep in the same way most mornings, and repeatability is the entire mechanism here. Morning glucose already runs higher for reasons that have nothing to do with your cycle, so the signal shows up clearly. Pick something you would eat anyway. A test meal you abandon in a fortnight teaches you nothing.
Single readings will mislead you. What counts is whether the difference repeats. One high number in your luteal phase is noise. The same meal peaking higher and taking longer to come down, across two or three cycles, is a pattern worth taking to your care team.
If you have type 1 diabetes
The comparison works the same way, and cycle-related glucose shifts are better documented in type 1 than in type 2. Where the pattern goes stays the same too. Anything you notice is information for your care team, not a reason to change what you are doing on your own. SNAQ is not an insulin dosing tool and should never be used as one.
What should you log to make that comparison work?
Only enough to explain the difference between the two curves. Every extra field you agree to fill in is one more thing that quietly goes stale in week three and then makes the whole log feel like a failure.
| What to log | Why it matters here | How often |
|---|---|---|
| Cycle phase | This is the one that separates a hormonal shift from a food effect. Without it, a mid-cycle change just looks like random noise. | Once a day. One word is enough. |
| The meal itself | Portion, carbs, and fiber are the parts you can actually hold steady. The same meal logged the same way is what makes a comparison possible. | Every time you eat your comparison meal. |
| Glucose around that meal | Before, and roughly two hours after. The gap between those two readings is the signal you are looking for. | Comparison meals only. Not all day. |
| Movement | A walk after eating can change the curve for that meal. If it goes unlogged, it looks like the food behaved differently. | When it happens. Not every step. |
| Sleep | A run of short nights can show up in glucose with no obvious food explanation, which is exactly the kind of thing that gets blamed on a meal. | A rough note. Good night or bad night. |
| Weight (optional) | Only worth logging if it is already part of the plan you agreed with your care team. If it is not, skip this row entirely. | Whatever your care team suggested. |
If you want the shortest possible version of this, we wrote one: minimum viable meal logging.
Fiber is on there because you can change it without rebuilding the whole meal, and because added fiber and natural fiber can behave differently. Sleep is on there for a sneakier reason. A rough night can show up in the next day's glucose, and if you have not written it down, Tuesday's breakfast takes the blame for Monday's 3am.
What can you skip?
Stress scores, hydration, supplements, step counts, and the dozen other fields your app will happily offer you.
Those things matter. They also cost attention you need for the three that carry the comparison. Add a fourth when a pattern stays unclear and you have a specific reason to suspect something. More data is not more clarity.
What does a realistic weekly rhythm look like?
Log your comparison meal properly whenever you eat it. A photo works. Portion context matters more than precision.
Your cycle phase goes in the same place, one word, no more than that. If your cycles are irregular, write down what you can actually observe, like the day your period started or a symptom you recognise.
Glucose readings bracket the meal: one before, one roughly two hours after. On a CGM, look at the shape and let the peak number go. Without one, structured fingerstick testing works for this too.
Then review weekly. Checking every evening turns ordinary variation into a problem you feel obliged to solve before bed, which is how tracking starts costing more than it returns. Weekly is where repeated shapes surface.
How long until a pattern shows up?
Usually one to two full cycles, not one to two weeks.
Most tracking advice implies something faster, which is how people end up quitting at day ten with a fortnight of decent data and no idea it was decent. You need the same meal logged in both phases at least twice before a difference means anything. Irregular cycles take longer again.
Where SNAQ fits
The comparison above is tedious by hand. You are scrolling back three weeks to find a Tuesday breakfast, squinting at two curves on a phone, trying to remember whether you walked afterwards.
SNAQ shortens the logging step. Photograph the meal, get carbs, fiber, protein, and fat back, and the same meal logged twice gives you the same numbers twice. That comparability is the whole point. Connect your CGM and meal markers land directly on your glucose curve, which is what makes shape comparison possible at all.
Where it stops short: there is no cycle phase field in the app today, so you would note it in free text alongside the meal. SNAQ will not flag a cycle pattern for you either. You spot it on the graph yourself, or you work it through with the AI nutritionist, which beats the scrolling.
SNAQ does not replace your CGM app, your care team, or your treatment plan, and it should never be used to calculate insulin doses. It is the layer that makes the comparison cheap enough that you actually run it. Learn more about SNAQ.