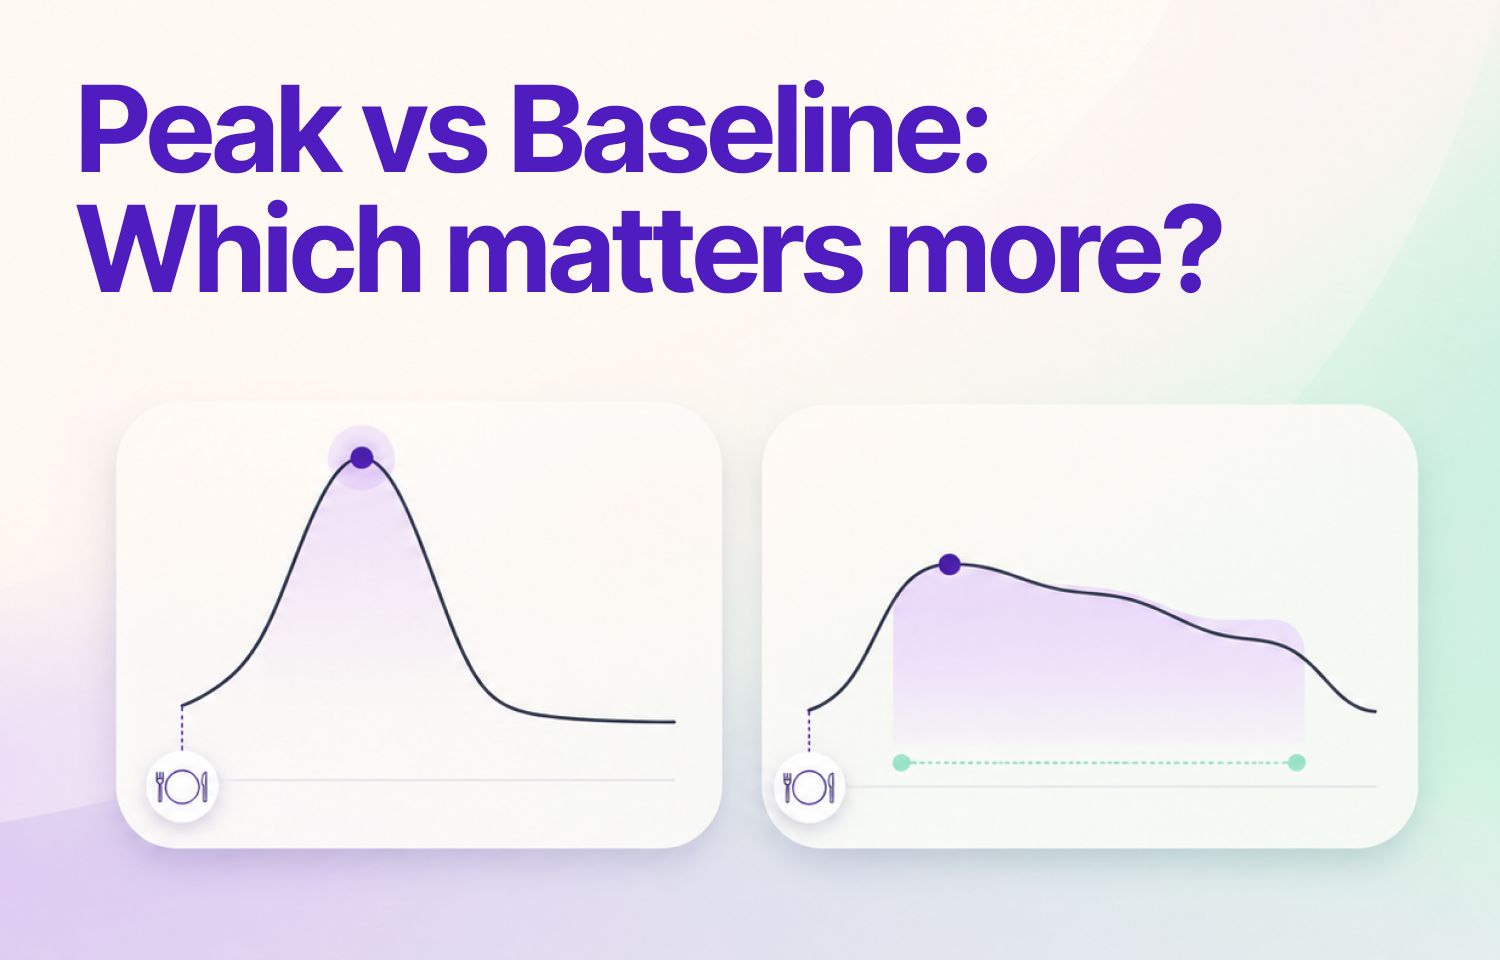
Most people reading their CGM graph focus on one thing: how high the line went. The peak feels like the score. But it only tells half the story.
The other half is how long your glucose stayed elevated before coming back down. That return to baseline is often what separates a manageable meal from one that keeps you out of range for hours. Understanding both parts of the curve helps you read your data more clearly and make better decisions about food.
What the Glucose Curve Actually Shows
After you eat, glucose rises. Your body responds by moving that glucose into cells, through insulin your pancreas produces, or insulin you take. The curve on your CGM captures that entire process as it happens.
Two points define the shape:
The peak is the highest glucose level reached after eating. It reflects how fast carbohydrates entered your bloodstream and how quickly your body began responding.
The return to baseline is how long it takes to get back to your pre-meal glucose level. It shows how efficiently your body cleared that glucose and how long the process took.
Both are shaped by what you ate, your insulin sensitivity, your activity level, stress, and the timing of your previous meal.
Why Peaks Get So Much Attention
Peaks are hard to ignore. They trigger CGM alarms. They register immediately. And there are real reasons to pay attention to them.
Research shows that frequent glucose spikes contribute to oxidative stress, which over time can affect blood vessels and increase cardiovascular risk.A sharp peak after a meal is often a signal worth investigating: whether that's a carb estimate that was off, a meal composition that hit fast, or a morning when insulin sensitivity was lower than usual.
But the peak alone doesn't tell you enough. A reading of 200 mg/dL that drops back to baseline in 90 minutes creates a different glucose profile than a reading of 170 mg/dL that stays elevated for three hours. The peak number looks worse in the first case. The overall glucose exposure is likely worse in the second.
Why Return to Baseline Deserves Equal Attention
A slow return to baseline means glucose stayed elevated longer. That time adds up across meals and across days.
Studies link prolonged glucose elevation to poorer glycemic control and higher A1C over time. For many people, shortening return time has more impact on overall glucose management than reducing peak height by a small margin.
If your glucose consistently takes four or more hours to return to baseline after meals, that pattern is worth examining. It reduces your time in range and raises your daily average, even if your peaks look acceptable on their own.
A faster return to baseline generally reflects better insulin sensitivity and more efficient glucose clearance. It's one of the more useful things your CGM curve can tell you about how your body is responding to food over time.
When to Focus on Each One
Context changes which part of the curve is most relevant.
Focus on the peak when:
- You're testing a new food and want to understand its immediate glucose impact
- You're experiencing symptoms like fatigue or brain fog during high spikes
- You're troubleshooting post-meal strategies like walking or meal sequencing
- You're trying to stay below a specific threshold after meals
Focus on return to baseline when:
- Your peaks look reasonable but your time in range is still lower than expected
- Your glucose from one meal is still elevated when the next meal starts
- You want to understand longer-term metabolic trends
- You're evaluating whether a meal creates prolonged elevation, not just a high point
In practice, you need to watch both. A meal that peaks at 160 mg/dL and returns to baseline in 90 minutes is likely a better outcome than one that peaks at 150 mg/dL but keeps you elevated for three hours.
| Aspect | Glucose Peak | Return to Baseline |
|---|---|---|
| What it shows | How fast and how high glucose rose after eating. Reflects carb absorption speed and how quickly your body started responding. | How efficiently your body cleared glucose after the peak. Reflects insulin sensitivity and the duration of glucose elevation. |
| What influences it | Carb type and quantity, meal composition, activity before eating, time of day, stress levels. | Insulin sensitivity, fiber and fat content of the meal, activity after eating, sleep quality, overall metabolic health. |
| When to focus here | Testing a new food, troubleshooting a specific spike, tracking symptoms like fatigue or brain fog after meals. | Time in range is lower than expected, glucose from one meal is still elevated when the next starts, evaluating long-term trends. |
| Common warning sign | Consistent peaks above your care plan threshold, especially if paired with symptoms. | Return time consistently longer than 2–3 hours across most meals — a pattern worth discussing with your care team. |
| One thing to try | Eat protein or fat before carbohydrates (meal sequencing), or take a short walk right after eating. | Add fiber and non-starchy vegetables to your plate, and avoid stacking high-carb meals close together. |
Note: Targets vary by individual. Always discuss your personal glucose goals with your healthcare provider or care team.
Reading Your Curve in Real Meals
Start by logging a few typical meals and noting both the peak and the time it takes to return to your pre-meal level. Look for patterns, not individual data points.
If you eat oatmeal and peak at 170 mg/dL within 45 minutes, then return to 95 mg/dL by the two-hour mark, that's a sharp peak with a fast return. If the same meal peaks at 160 mg/dL but keeps you above 130 mg/dL for three hours, the peak was lower, but the total glucose exposure was higher.
Protein and fat slow digestion. A higher-fat meal may produce a moderate peak followed by a long, gradual tail. That's not automatically a problem, but it's worth recognizing so you don't evaluate the meal based on peak height alone.
Stress, illness, and activity all shift the curve too. A short walk after eating can flatten the peak and speed up the return. Poor sleep or a stressful afternoon can elevate both. Compare similar conditions when drawing conclusions about specific foods.
SNAQ's CGM integration overlays your meals directly on your glucose graph, so you can see exactly when you ate and how your curve responded. Over time, this builds a reference library of your own meal patterns.
If you're not sure what a pattern means, SNAQ's AI Coach can look at your logged data and answer your specific questions, so you're not left interpreting a curve on your own.
When Both Are Off
Some meals produce a high peak and a slow return. These are the ones worth rethinking first. They create the most glucose exposure and the longest time out of range.
Large portions of refined carbohydrates eaten without protein, fat, or fiber tend to follow this pattern. Glucose rises fast because there's little to slow absorption, and the volume keeps it elevated for hours after.
If you see this pattern consistently, you have a few options. You can reduce the portion size, pair the carbs with protein or fat, or swap for a lower glycemic alternative. You can also test whether eating that same food earlier in the day, when insulin sensitivity is typically higher, changes the curve.
Addressing meals where both peak and return time are problematic usually delivers the biggest improvement in time in range. Our guide on how to improve your time-in-range after meals covers specific strategies in more detail.
What "Normal" Looks Like (and Why It Varies)
People without diabetes typically peak below 140 mg/dL after meals and return to baseline within two hours. For people with diabetes, peaks tend to be higher and return times longer, but targets vary by individual.
Some care plans use a post-meal peak goal of under 180 mg/dL. Others aim lower. Return to baseline goals are generally two to three hours, though meal size, composition, and your individual metabolism all affect this.
What matters most is your own pattern. If your pre-meal baseline is 110 mg/dL and you consistently return to that level within two hours, that's a meaningful reference point. If your return time stretches to four hours regularly, or your baseline drifts higher over weeks, those are signals worth investigating.
Occasional high peaks happen. But if most breakfasts send you well above your target and keep you there for hours, that's a pattern you can work on. Many factors affect your glucose levels, from sleep quality to what you ate the night before, and understanding those helps you read your curve with more context.
Practical Steps to Improve Both
Start with one meal per day. Note the peak, the return time, and how you felt. Make one small change and observe what shifts.
To lower peaks:
- Eat protein or fat before carbohydrates (meal sequencing)
- Reduce portion sizes of high glycemic foods
- Swap refined carbohydrates for lower glycemic alternatives
- Take a 10-minute walk right after eating
To speed up return to baseline:
- Add fiber and non-starchy vegetables to your plate
- Avoid eating a high-carb snack while your glucose from a previous meal is still elevated
- Keep meal timing consistent where possible
- Prioritize sleep: poor sleep reliably slows glucose clearance
Activity supports both. Even light movement after eating improves insulin sensitivity and helps clear glucose faster.
SNAQ's AI Photo Analysis gives you carb counts and macro breakdowns from a photo of your meal, so you can connect what you ate to what your curve did, without manual logging. The Trend Insights feature tracks patterns over weeks, so you can see which meals consistently produce better or worse curves. You can also ask the AI Coach directly, it reads your data and gives you answers based on what you've actually logged, not generic advice.
The Short Version
The peak tells you how high and how fast glucose rose. The return to baseline tells you how well your body cleared it. Neither one is more important in every situation.
Watch both. Track patterns across similar meals. Make one change at a time and measure what shifts. Your CGM is giving you real data, and the goal is to learn how to read it.
If you want to connect your meals directly to your glucose curve and spot patterns faster, download SNAQ on App Store or Google Play, log a meal with a photo and see your data in context.
References
1. American Diabetes Association. Standards of Medical Care in Diabetes — 2023. Diabetes Care, 2023.
2. Peters AL, et al. The Role of Continuous Glucose Monitoring in Diabetes Treatment Guidelines. The Endocrine Society, 2023.
3. Monnier L, Colette C. Glycemic Variability: Should We and Can We Prevent It? Diabetes Care, 2008.
4. Hirsch IB, Brownlee M. The Effect of Acute Glycemic Variations on Oxidative Stress and the Development of Diabetes Complications. J Clin Endocrinol Metab, 2005.
5. Heinemann L, Budd J. Use of Technology to Improve Diabetes Management. Diabetes Technol Ther, 2022.
The SNAQ website does not contain medical advice. The contents of this website, such as text, graphics, images and other material are intended for informational and educational purposes only and not for the purpose of rendering medical advice. The contents of this website are not intended to substitute for professional medical advice, diagnosis or treatment. Please consult your healthcare professional for personalized medical advice.