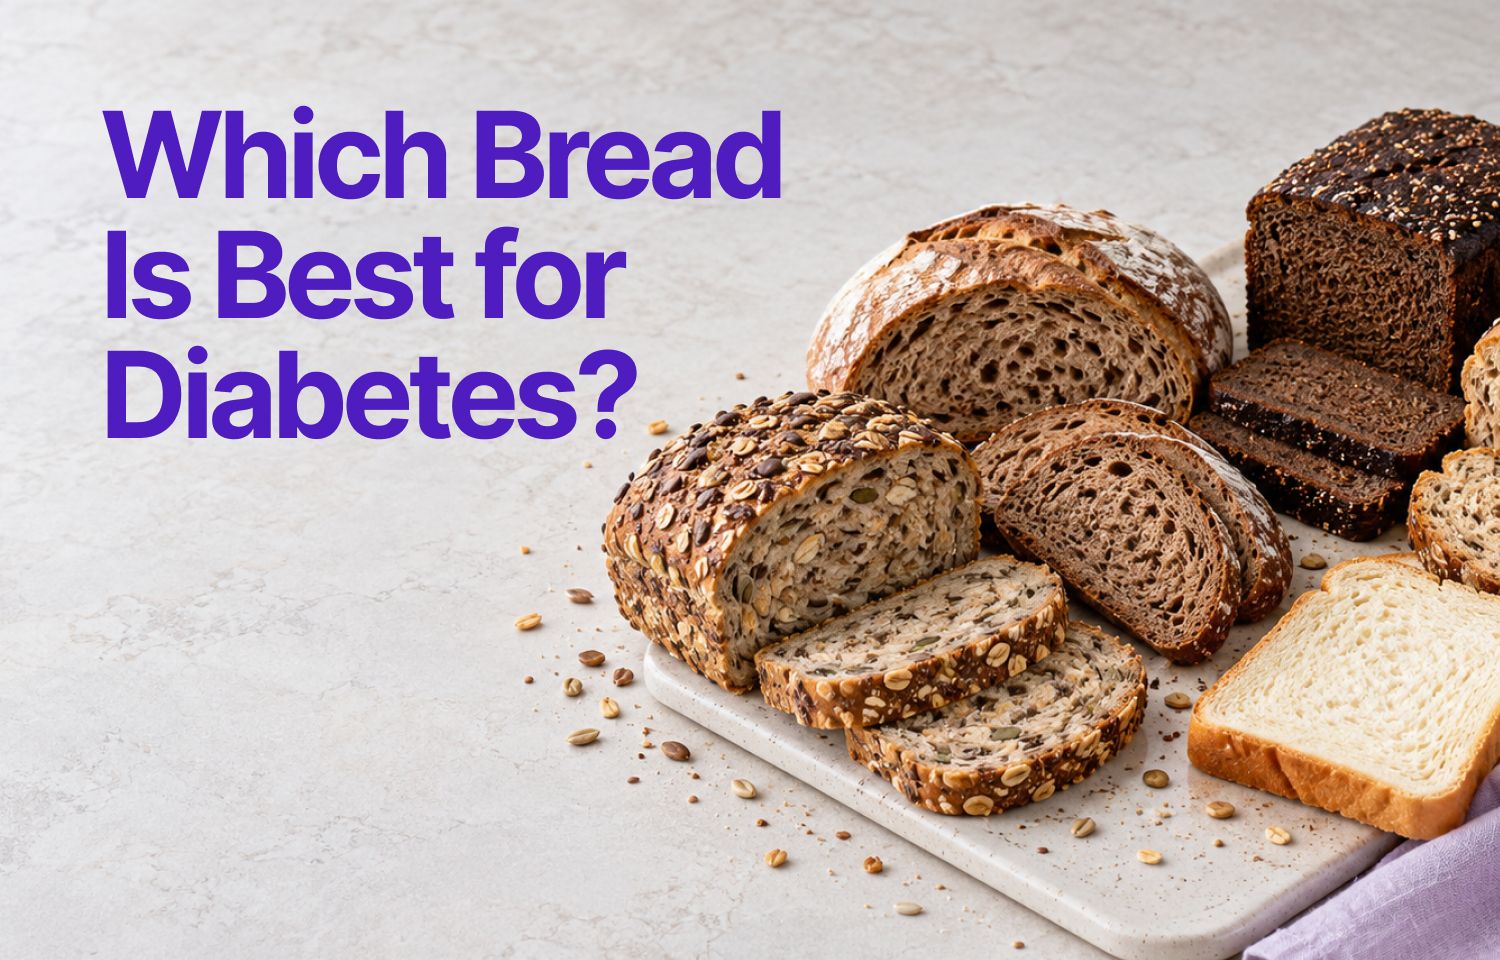
Quick answer: Nobody has proven which bread is best for diabetes, and no study has tested all 15 of these against each other. Our ranking is a judgment call based on the research we could find. Sprouted grain bread, whole grain rye, and pumpernickel come out on top. When you're shopping, look for a whole grain as the first ingredient, at least 3 grams of fiber per slice, and little added sugar. After that, test the bread on your own glucose, because people respond to the same loaf differently.
Is whole wheat really better than white? Is sourdough? What about the bread with "keto" on the bag? We went looking for answers, and the honest summary is that the research is thin. Most glucose studies on bread are small and short, and a lot of them used healthy volunteers instead of people with diabetes. So take the ranking below as our best read. The three groups matter more than the exact order, because the evidence can't separate rank 7 from rank 8. None of this is medical advice. Your care team is the right place to set your personal targets.
| Rank | Bread | What to look for | Watch out for |
|---|---|---|---|
| Best bets: ranks 1 to 5 | |||
| 1 | Sprouted grain | Sprouted whole grains listed first, 3+ g fiber per slice | Added sweeteners |
| 2 | Whole grain rye | Whole grain rye or rye kernels listed first | Light rye that is mostly wheat flour |
| 3 | Pumpernickel | Whole grain rye or rye meal listed first | Loaves that are mostly white flour with coloring |
| 4 | Whole grain sourdough | Whole grain flour first, plus a sourdough culture | Commercial yeast with sourdough flavoring |
| 5 | Low-carb bread | Low total and net carbs, with some whole grain or protein | Heavy use of added fibers, which can cause gas or bloating |
| Solid choices if the label checks out: ranks 6 to 11 | |||
| 6 | High-fiber whole wheat | Whole wheat first, 5+ g fiber per slice | Added sugar or refined flour behind the fiber number |
| 7 | Seeded whole grain | Whole grain first, seeds throughout the loaf | Dense, heavy slices with more carbs |
| 8 | Oat bread | Whole grain oats or oat flour high on the list, 3+ g fiber | Mostly wheat flour with a little oat |
| 9 | 100% whole wheat | Whole wheat listed first | Fiber varies a lot by brand |
| 10 | Multigrain | "Whole grain" before every grain listed | Enriched flour listed first |
| 11 | Whole wheat pita | Whole wheat listed first | Carbs per pita can be much higher than per slice |
| Occasional breads: ranks 12 to 15 | |||
| 12 | White sourdough | A sourdough culture, "naturally leavened" | Little fiber, and fast yeast in some loaves |
| 13 | Honey wheat | Low added sugars | More than about 2 g added sugar per slice |
| 14 | Standard white | Not a pick, but the baseline most studies compare against | Low fiber and quick digestion |
| 15 | Sweet and enriched | Sugar and fiber per serving | Refined flour, added sugar, low fiber |
How to read this: ranks are our editorial judgment from published research, fiber, and label quality. They are not the result of a head-to-head trial.
How We Ranked These Breads
Four things went into it. A bread moved up when most of them pointed the same way.
- Glycemic index (GI). A score for how fast a food raises glucose compared with a reference food. GI numbers shift from study to study, and low-GI foods can still spike glucose, so we treated it as a rough guide.
- Fiber. Fiber slows digestion and helps you feel full, so more per slice counted in a bread's favor.
- Whole grain vs. refined grain. In a 2013 review of studies that followed large groups of people, those who ate more whole grains had a lower risk of type 2 diabetes. That's a link. It doesn't prove whole grains are the cause.
- Glucose studies on the bread itself. These counted the most, but most were small and short. We found none for seeded, high-fiber wheat, low-carb, or sweet breads, so those ranks rest on ingredients.
Marketing claims with nothing behind them pushed a bread down.
How to Read a Bread Label
Ignore the front of the bag and check four things on the back.
- First ingredient: a whole grain. Look for whole wheat, whole rye, whole grain oats, or sprouted whole grains. If "enriched flour" or "wheat flour" comes first, the loaf is mostly refined flour, whatever the front says. "Wheat bread" and "multigrain" don't promise anything. Some dark loaves are just white flour colored with caramel.
- Fiber: about 3 grams or more per slice. Some loaves hit big numbers with added fibers like inulin, so check the ingredient list too.
- Added sugars: about 2 grams or less per slice. They get their own line on the Nutrition Facts label. Bread shouldn't taste sweet.
- Slice size. The label uses whatever slice the baker picked. Compare carbs per slice, then count how many slices you really eat.
The 3 gram and 2 gram cutoffs are our own rules of thumb. They aren't official guidelines.
Best Bets: Ranks 1 to 5
1. Sprouted Grain Bread (Ezekiel-Style)
Sprouted grain bread is made from whole grains that were allowed to sprout before baking. Many loaves are dense and high in fiber. It takes the top spot mostly on the strength of one study. In a small 2012 study of overweight and obese men, it gave a lower glucose response than white bread, a sourdough, and an 11-grain bread when each had the same amount of carbs. It also caused a higher insulin response than white bread, so the picture isn't all good news. That's a thin base, so hold the rank loosely. Sprouted whole grains should come first on the label, and some brands add sweeteners.
2. Whole Grain Rye (Dense, Dark Rye)
Rye is where the research gets specific. In healthy adults, whole kernel rye bread produced a lower insulin response than wheat bread, but the same glucose response. That isn't the same as a smaller spike, so rye ranks high mostly as a package. It's whole grain and high in fiber, and in trials it left people feeling fuller. Pick loaves that list whole grain rye or rye kernels first. Lighter rye breads often lean on wheat flour.
3. Whole Grain Pumpernickel
Traditional pumpernickel is made from coarsely broken rye grain and baked for many hours into a dark, dense loaf. It ranks here for the same reasons as rye, and the International Tables of Glycemic Index list lower values for rye and pumpernickel breads than for white bread. Make sure rye or rye meal comes first on the label, because some supermarket loaves are mostly white flour with coloring.
4. Whole Grain Sourdough (Stone-Ground)
Sourdough's reputation is bigger than its evidence. One review of the clinical studies found that fermenting bread with a sourdough culture can change the glucose response, possibly because of the organic acids it produces, though the exact reason hasn't been confirmed. The trials are messier than that sounds. In a small trial of 20 healthy adults, whole grain sourdough and white bread gave similar results on average, and about half the participants did better on white bread. A review of sourdough studies found no significant glucose difference in more than half of the studies that compared sourdough with white bread in healthy people. The whole grain base and the fiber are what keep it in our top five. Look for whole grain flour first and a real sourdough culture, since some "sourdough" loaves are regular yeast bread with a little sourdough flavoring.
5. Low-Carb Bread (Fiber-Supplemented)
Low-carb bread has fewer digestible carbs per slice, because some of the flour gets swapped for added fiber or protein. Quality varies a lot. Check the total carbs, the fiber, and the net carbs, which is what's left after you subtract fiber. Then look at what the added fiber is, since some added fibers cause gas or bloating in some people. Whole grains or protein on the ingredient list are a better sign than added fibers alone.
Solid Choices If the Label Checks Out: Ranks 6 to 11
6. High-Fiber Whole Wheat (5+ Grams per Slice)
Wheat bran, oat fiber, or inulin can push a whole wheat loaf to 5 grams of fiber or more per slice, and the whole grain base helps. Make sure added sugar or refined flour isn't hiding behind the big fiber number.
7. Seeded Whole Grain Bread
Flax, chia, sunflower, and pumpkin seeds add fiber, fat, and some protein. How much they help depends on how many seeds are actually in the loaf, so look for seeds throughout, not just on the crust. Seeded loaves run dense and heavy, so check the carbs per slice.
8. Oat Bread (Whole Grain Base)
Oats carry beta-glucan, a soluble fiber that researchers have studied for its effect on after-meal glucose. Many commercial oat breads are mostly wheat flour with a little oat on top, though. Whole grain oats or oat flour should sit high on the ingredient list.
9. 100% Whole Wheat Bread (Standard)
Standard whole wheat is a fine everyday bread, but its GI sits close to white bread's. Across studies, the average GI of bread made from whole wheat or white flour was about 71. The case for whole wheat is its fiber, its nutrients, and the whole grain research above. Fiber varies a lot by brand, so compare labels.
10. Multigrain Bread (Whole Grain Base)
"Multigrain" just means more than one kind of grain. In the same 2012 study that favored sprouted grain bread, the other whole grain breads didn't improve the short-term glucose response. A true whole grain multigrain can be a fine choice, but some are mostly refined flour with a few grains added. Look for "whole grain" in front of every grain on the list.
11. Whole Wheat Pita or Flatbread
A pita made from 100% whole wheat can work. Some pitas are mostly white flour, so check the first ingredient. Sizes vary a lot too, and some pitas hold far more carbs than a slice of bread. What goes inside changes the meal as well.
Occasional Breads: Ranks 12 to 15
12. White Sourdough
White sourdough is refined flour, so there's little fiber to work with. Fermentation may soften its glucose impact a bit, but the results are mixed, as the reviews above show. With so little fiber, it sits below the whole grain breads. On the label, look for a sourdough culture or "naturally leavened."
13. Honey Wheat or Sweetened Whole Wheat
Honey wheat is whole wheat flour plus honey or sugar. That sugar adds carbs with no extra fiber, so check the added sugars line on the label.
14. Standard White Bread
White bread is refined flour with the bran and germ taken out, so very little fiber is left. Its GI usually lands around 70, and it tends to fill you up less than whole grain bread. It's also the baseline most studies measure everything else against.
15. Sweet and Enriched Breads (Brioche, Challah, Hawaiian Rolls)
These are made with refined flour, eggs, butter, and often sugar. Fiber is low and sugar varies by recipe. We found no direct glucose studies on these, so the rank rests on those ingredients. They're an occasional bread, and rolls disappear fast, so watch the portion.
Why Your Results May Differ From Any Ranking
A ranking describes the average person, and your glucose may not follow it. The sourdough trial above shows why. Each person ate whole grain sourdough for a week and white bread for a week. The averages looked alike, but the results split from person to person, and the researchers linked part of that to differences in gut bacteria. So if a bread that's supposed to be a good one sends your curve up, that tells you something about your body. The trial was small and used healthy adults, so it can't predict how any one person with diabetes will respond.
Timing matters too. In the early morning, hormones like cortisol and growth hormone push your glucose up before you eat. That's the dawn phenomenon, and it's why the same toast can rise more at 7 a.m. than at noon, as we cover in why breakfast spikes glucose more than lunch or dinner. Sleep, activity, stress, and what else is on the plate play a part too.
How to Eat Bread in a Glucose-Aware Meal
Bread rarely comes alone, so the rest of the plate matters.
Pair it with protein, fat, and fiber. They slow down how fast a meal digests, so a sandwich with turkey, cheese, and avocado tends to rise more gently than bread alone.
Count the whole plate. Two slices, a piece of fruit, and a sauce add up to more carbs than the bread alone suggests. Our guide to finding your carb range explains why there's no single target for everyone.
A Simple 3-Meal Test for Any Bread
The only way to know how a bread treats you is to test it.
- Pick one bread and one meal. Keep the portion, toppings, and time of day as close as you can.
- Eat it three times. One meal can mislead you, since sleep, activity, and stress all move the result. Repeating the same meal shows whether the pattern is real.
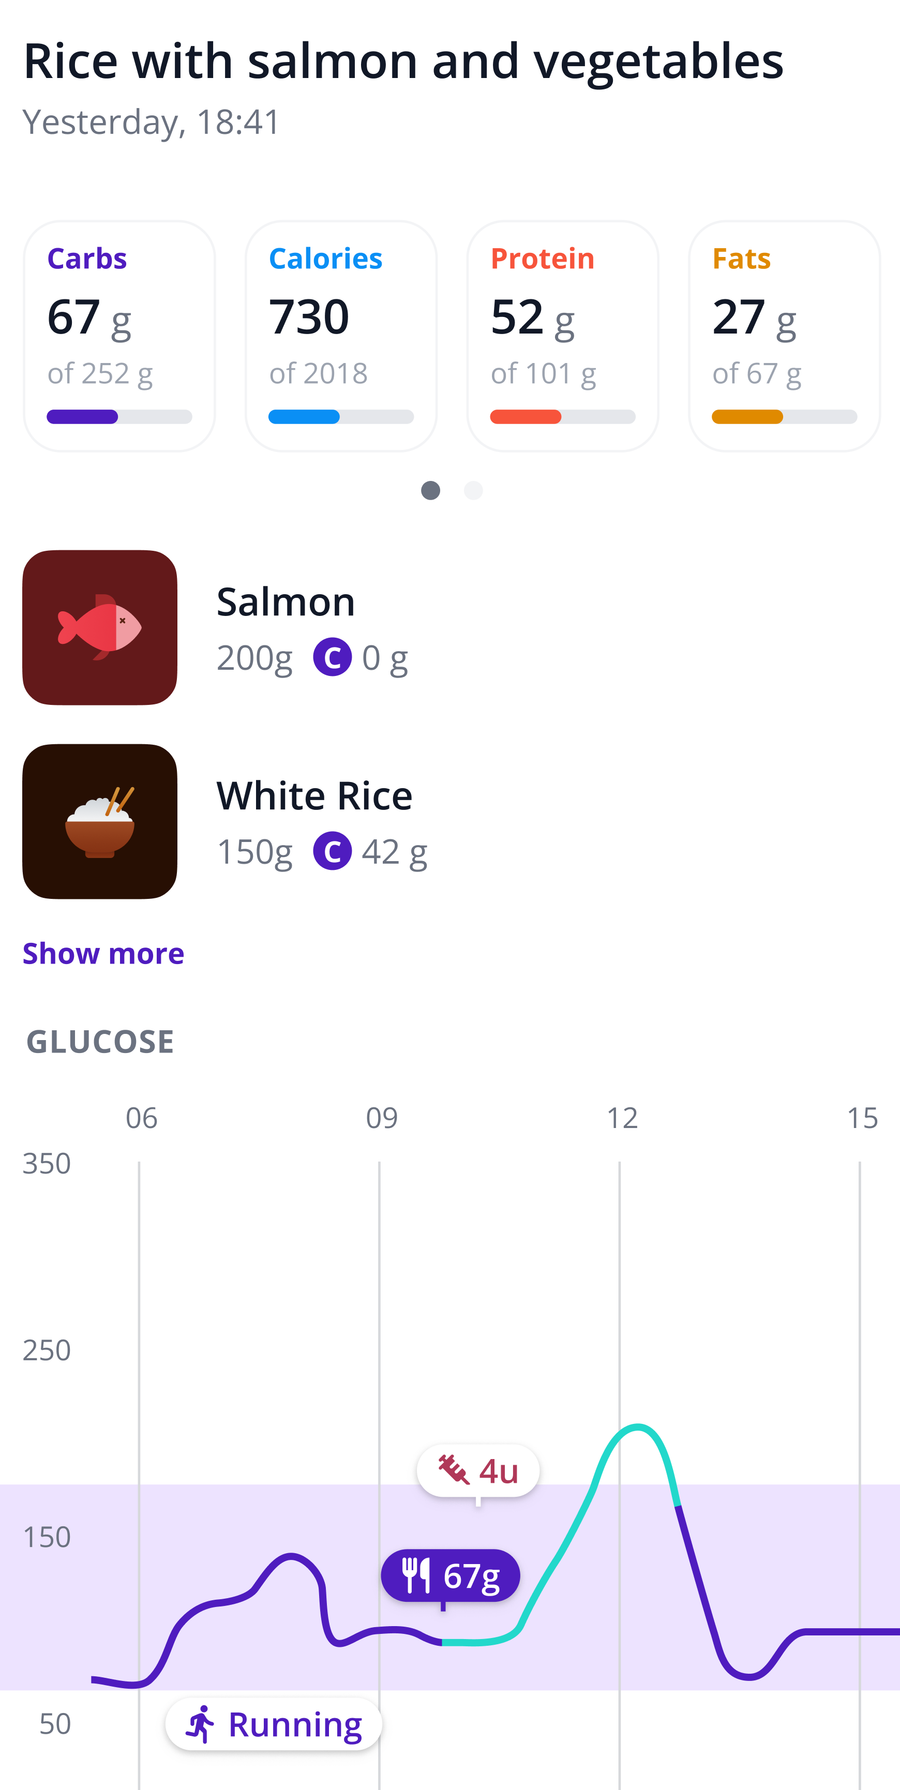
- Log each one. In SNAQ, snap a photo, get an editable carb estimate, and save the bread and whatever you ate with it.
- Read the curve. With a CGM connected, SNAQ puts the meal on your glucose curve and can show a predicted glucose peak for the meal. Compare it with your own target. Many care plans use a post-meal peak under 180 mg/dL, measured 1 to 2 hours after the start of the meal, but yours may differ. No CGM? Fingerstick readings before eating and 1 to 2 hours after work too, and you can keep them with the meal in SNAQ.
- Change one thing at a time. If a bread keeps you where you want to be, keep it. If it doesn't, try a different bread, a smaller portion, or a different plate, then run the test again.
Glucose insights in SNAQ are for education and personal tracking. Your personal targets should come from your care team.
SNAQ keeps the logging and the glucose curve in one place, so the test takes less effort. If you manage type 2 diabetes, our type 2 food tracker page has more. Download SNAQ