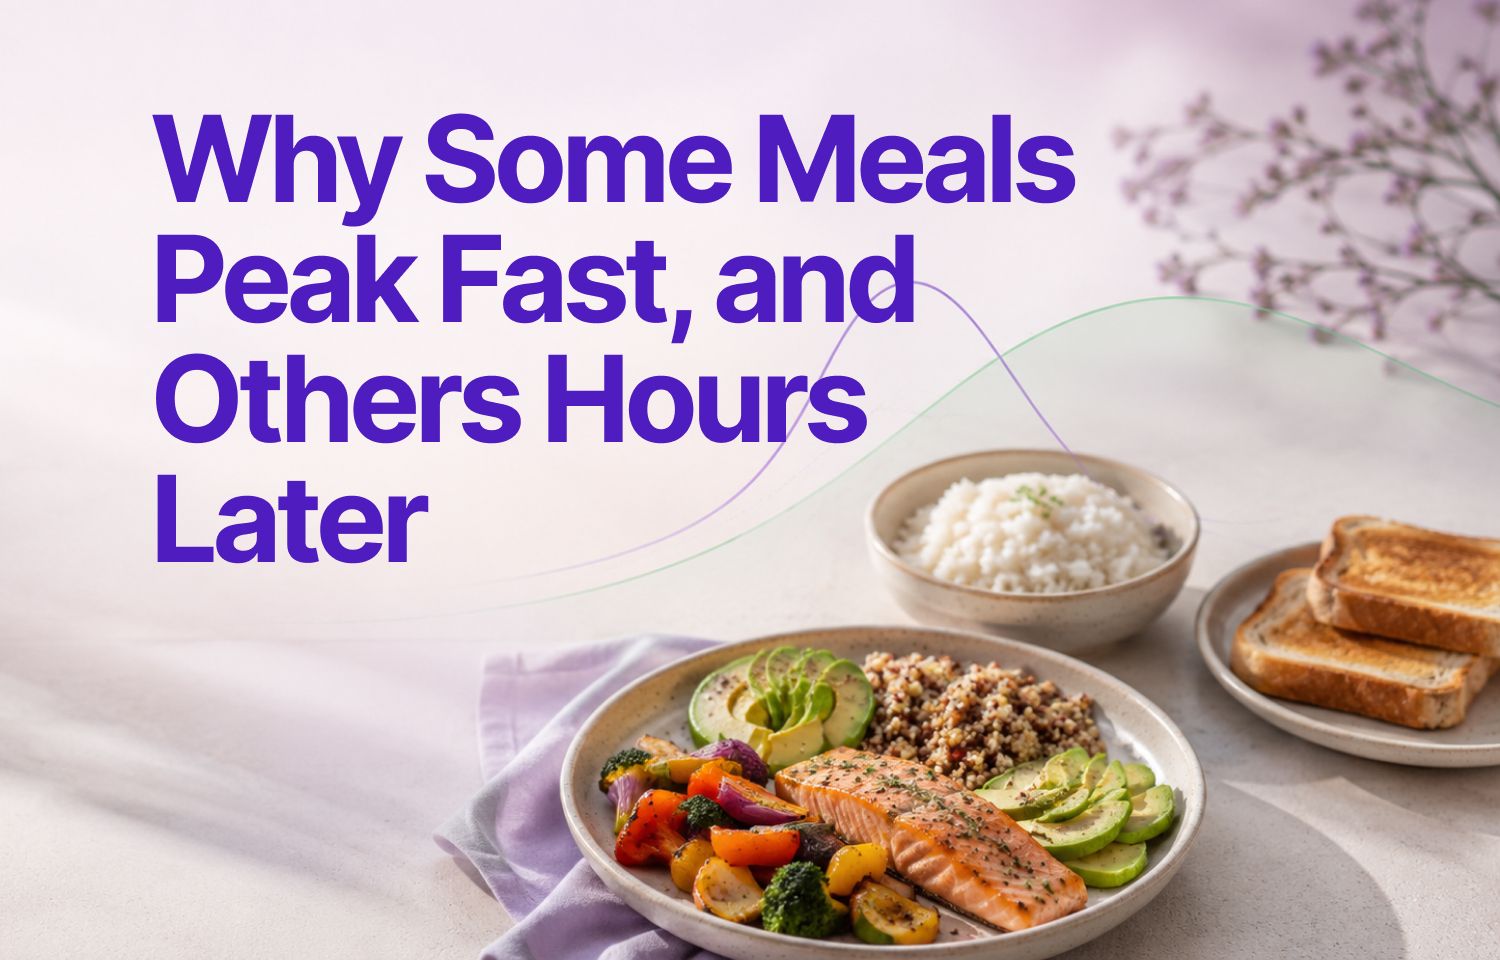
You finish a bowl of white rice and your glucose climbs within 45 minutes. The next day, salmon with roasted vegetables, and the rise is slower, softer, peaking somewhere around hour three.
Nothing else changed. So why the difference?
The answer is in how your body breaks food down. Once you understand it, your CGM data starts to make a lot more sense.
What Drives Peak Timing
The timing of your glucose peak depends mostly on how quickly your body can break food down into glucose and absorb it into your bloodstream.
Carbohydrates are the primary driver. Simple carbs like white bread, juice, or candy break down fast, often causing a peak within 60 to 90 minutes. Foods with more complex carbs, fiber, fat, or protein take longer to digest, which delays the glucose rise.
Meal composition matters just as much as the carb type. A slice of toast eaten alone will peak faster than that same toast eaten with peanut butter and an egg. The added fat and protein slow gastric emptying, which means glucose enters your bloodstream more gradually.
If your body still produces some insulin, the timing and strength of that response will also shape the curve.
How Fat and Protein Change the Curve
Fat and protein don't raise glucose directly, but they have a real impact on timing.
Fat slows digestion. A high-fat meal like pizza or a cheeseburger can delay your glucose peak by two to four hours. You might see a modest initial rise, followed by a second, later climb as the carbs finally absorb.
Protein has a gentler effect. In large amounts, especially without much carbohydrate, it can contribute to a slower glucose rise hours after eating. This is more noticeable in meals like a steak with non-starchy vegetables.
When you combine all three macronutrients in one meal, the result is often a flatter, longer glucose curve. Your CGM might show a plateau rather than a sharp spike. For some people, this feels easier to manage. For others, it makes meal timing less predictable.
If you're tracking your meals and noticing these delayed peaks, learning how different CGM curve shapes relate to meal composition can help you recognize the patterns faster.
Glycemic Index and Glycemic Load
Glycemic index (GI) ranks carbohydrate-containing foods by how quickly they raise blood glucose compared to pure glucose. High-GI foods cause faster, sharper spikes. Low-GI foods digest more slowly and produce gentler curves.
GI alone doesn't tell the full story. Glycemic load (GL) accounts for both the GI and the portion size. A food can have a high GI but a low GL if you're eating a small amount.
Watermelon is a good example. It has a high GI, but a typical serving contains relatively few carbs, so the glycemic load is moderate. A large bowl of white rice, on the other hand, has both a high GI and a high GL, which often leads to a fast, pronounced peak.
How you respond also depends on more than the food itself, which is why CGM data tends to tell you more than a GI chart will.
If you've noticed that some "low-GI" foods still cause unexpected spikes, this guide explains why that happens and what else might be at play.
When You Eat Matters Too
Your body's insulin sensitivity changes throughout the day, which can shift how quickly glucose peaks.
Many people notice that breakfast causes a faster or higher spike than the same meal eaten later in the day. This is often linked to hormonal patterns like the dawn phenomenon, which increases insulin resistance in the early morning.
Exercise also affects timing. If you eat shortly after activity, your muscles are more receptive to glucose, which can blunt or delay the peak. If you eat before exercise, you might see a quicker rise followed by a drop as your muscles use the glucose.
Stress, illness, and sleep quality all influence digestion speed and glucose response. A meal that normally peaks at two hours might peak at one hour if you're stressed or fighting off a cold.
What Your CGM Shows You
A CGM gives you the ability to see these patterns in real time, but reading the data well takes practice.
Look for trends over multiple days. A single outlier curve doesn't tell you much. But if you see that pasta consistently peaks at 90 minutes and chicken stir-fry peaks at three hours, you're starting to learn your own patterns.
Pay attention to the shape of the curve, not just the peak. A sharp spike that returns to baseline quickly is different from a gradual rise that plateaus for hours. Both might reach the same peak number, but they reflect different digestion dynamics.
Apps like SNAQ overlay your meal log with your glucose graph, which makes it easier to connect what you ate with how your glucose responded. You can scroll back through your week and spot patterns without manually matching timestamps.
Building a Meal Strategy Around Timing
Once you understand why peaks vary, you can start planning meals that fit your goals and your day.
If you want to avoid a sharp spike before a meeting or workout, meals with more fat, protein, and fiber tend to spread the curve out. If you need quick energy before activity and want a faster peak, a higher-GI snack may work better.
Pairing foods strategically can help too. Adding a handful of nuts to fruit, putting cheese on whole-grain crackers, or eating salad before pasta can all shift the timing and shape of your glucose curve.
You don't need to cut out high-GI foods. Knowing they'll peak faster helps you decide when and how to include them.
How SNAQ Helps You Spot These Patterns
The AI Photo Analysis feature lets you snap a picture of your plate and get an instant breakdown of carbs, fat, and protein. That makes it simpler to log mixed meals accurately, especially when you're eating out or cooking without a scale.
SNAQ's CGM integration overlays your meals on your glucose graph so you can see exactly when you ate and how your glucose responded. Over time, the Trend Insights feature surfaces patterns like "your glucose tends to peak 90 minutes after breakfast" or "dinners with more fat delay your peak to 3 hours."
If you want to understand why a specific meal caused a certain curve, the AI Coach can walk you through the factors at play. It's built to be educational, not prescriptive.
Voice Logging works on any device and lets you log meals in seconds if you describe them clearly. LiDAR-equipped iPhones (Pro models) get additional accuracy for portion estimation.
If you want to turn CGM curves into patterns you can actually use, try SNAQ. Download SNAQ