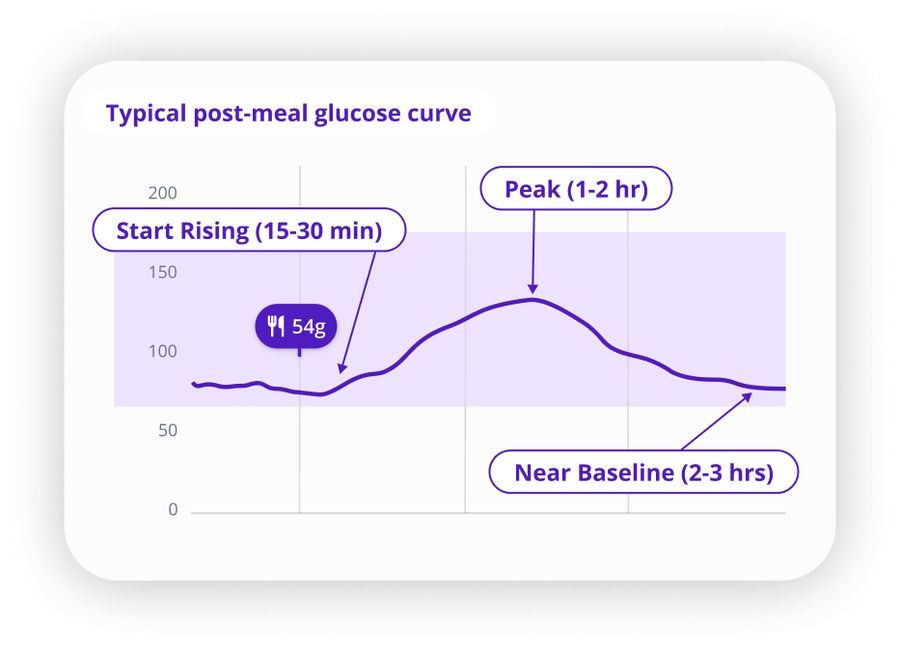
Quick answer: After eating, glucose usually starts rising within 15 to 30 minutes, peaks somewhere between one and two hours, and returns close to where it started within two to three hours. The exact shape of that curve depends on what you ate, how you moved, and how your body responds that day.
Your CGM graph just spiked after lunch. You're staring at the curve, wondering if this is normal or if something went wrong.
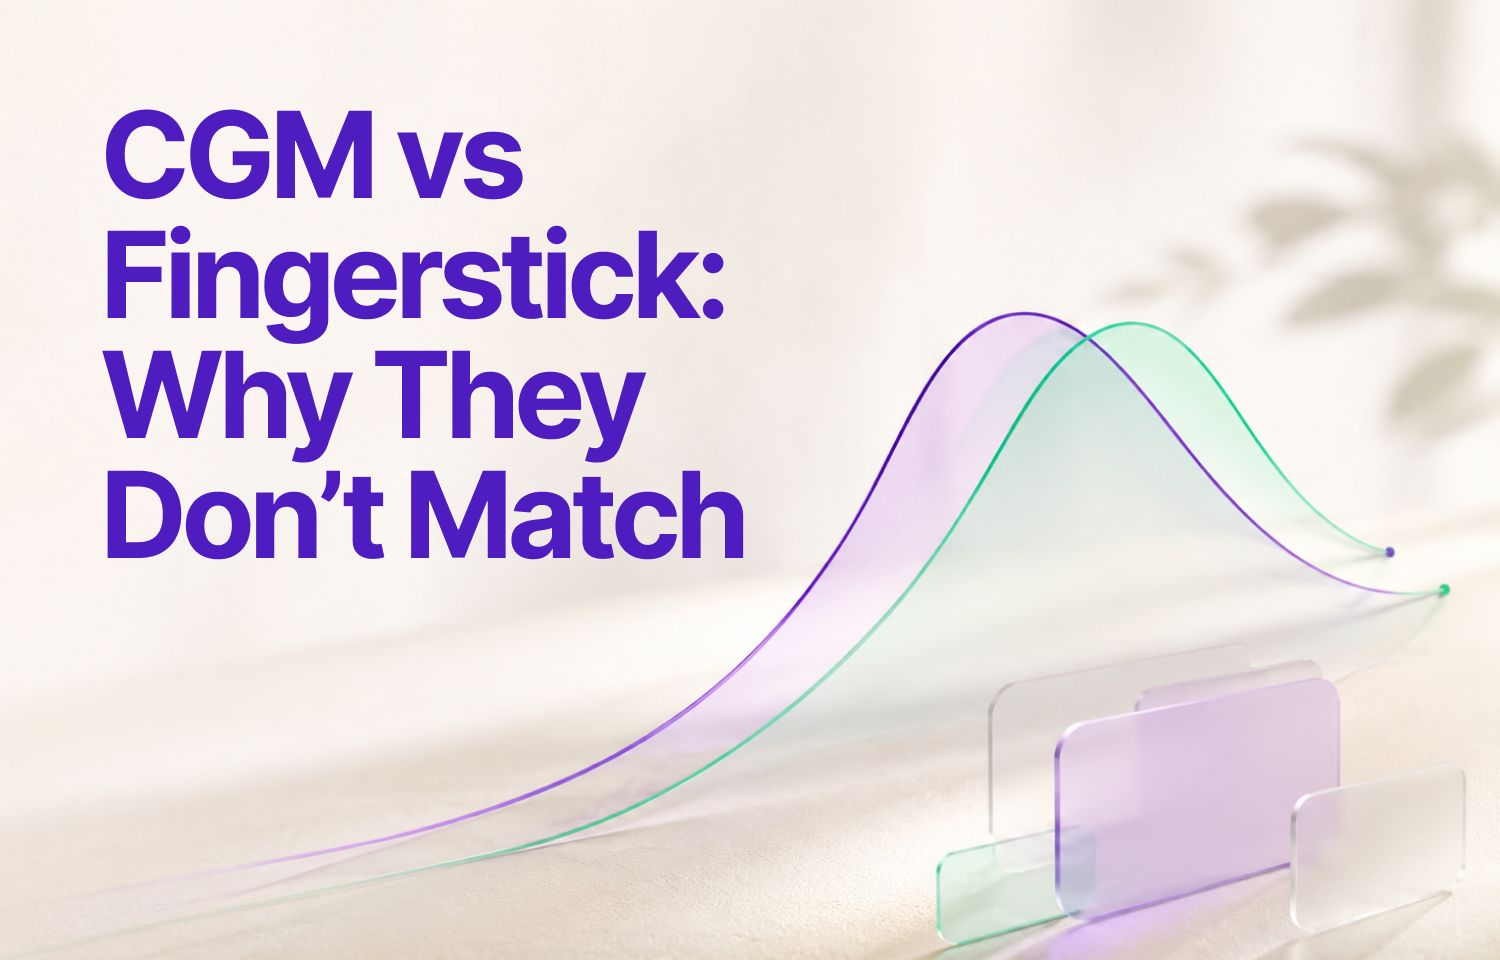
Most people expect a simple up-and-down pattern after eating. But real post-meal glucose responses look messier. The peak might arrive earlier or later than you'd expect. The descent might be gradual or steep. And the same meal can look different on different days.
Here's what's actually going on.
The Typical Post-Meal Pattern
After you eat, glucose levels usually start rising within 15 to 30 minutes. The peak typically lands somewhere between one and two hours after the first bite. From there, levels gradually come back down, often returning close to where they started within two to three hours.
This timeline shifts depending on what you ate, how active you were, and how your body handles glucose that day.
People without diabetes typically return to baseline faster because their pancreas responds quickly. People with diabetes often see a higher peak and a slower descent, particularly if meal composition or timing was off.
The shape of your curve reflects how your body handled that specific meal. A sharp spike followed by a steep drop often points to fast-acting carbs without much protein or fat to slow things down. A gentler, rounded curve usually means a more balanced plate or a meal with more fiber.
For more on what different curve shapes mean, see 5 common post-meal CGM curves and what changes the shape.
What Shapes Your Post-Meal Graph
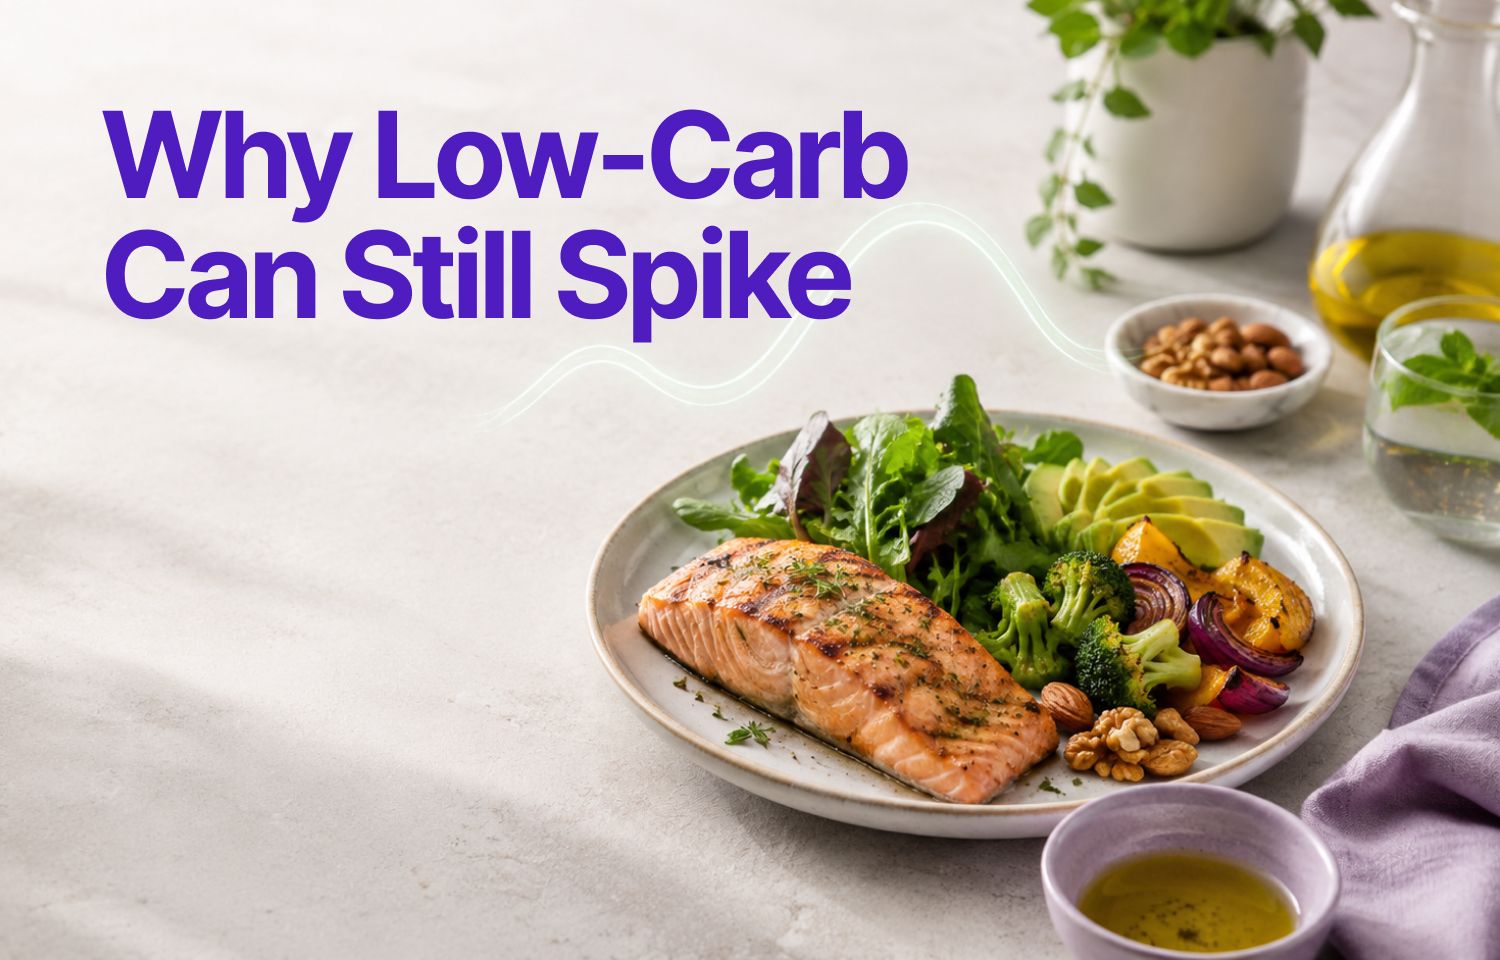
Carbohydrate type and quantity have the biggest effect. Simple carbs like white bread or juice move into your bloodstream quickly, creating a steeper rise. Complex carbs like oats or lentils release glucose more gradually, spreading the rise over a longer window.
Protein and fat slow digestion. A meal with chicken, avocado, and vegetables will generally produce a gentler curve than a plate of pasta on its own.
Movement helps too. A 10-minute walk after eating can lower the peak and bring glucose back to baseline faster. During and after movement, muscles take up glucose more actively, which dampens the rise.
Stress, illness, hormones, and sleep all affect how sensitive your body is to glucose that day. Your graph might look different on a high-stress day compared to a calm one, even if you ate the exact same meal.
For a deeper look at these variables, see factors impacting your glucose levels and what you can do about it.
Three Real Scenarios
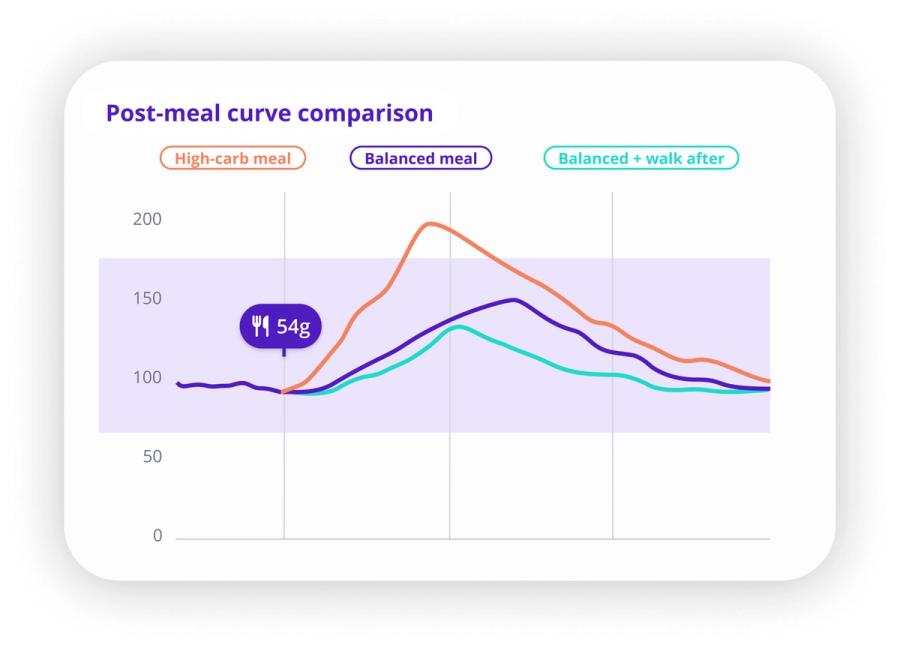
High-carb meal, minimal protein or fat
You eat a bowl of white rice with a small amount of vegetables. Within 30 to 45 minutes, glucose climbs quickly. The peak arrives around 60 to 90 minutes. The descent is slow, and levels may stay elevated for longer if you don't move afterward.
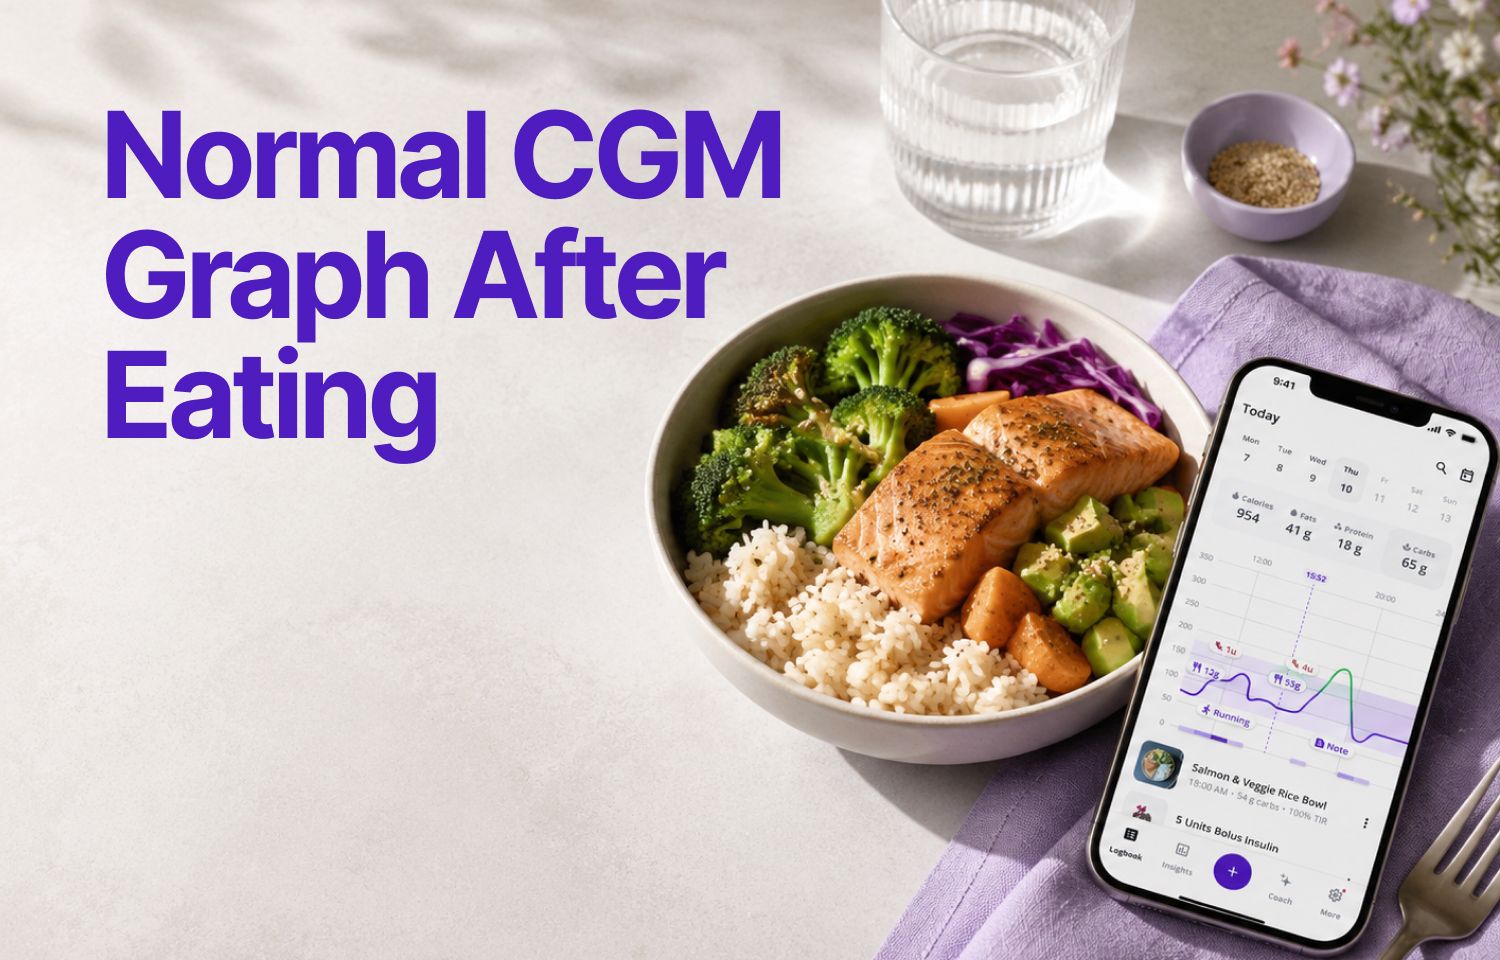
Balanced meal with mixed macronutrients
You have grilled salmon, roasted sweet potato, and a side salad with olive oil. The rise is more gradual. The peak lands closer to 90 minutes and sits lower than the high-carb scenario. The curve comes down more smoothly because fat and protein slow how quickly glucose enters your bloodstream.
Post-exercise meal
You eat the same balanced meal, but you walked for 15 minutes right after. The peak is lower, the curve is flatter, and you return to baseline faster. Your muscles are using glucose for recovery, which reduces the size of the spike.
A Note on CGM Lag
One thing worth knowing: CGM readings run a few minutes behind actual blood glucose, because the sensor measures glucose in the fluid under your skin rather than directly in your blood. During fast changes, like a steep post-meal rise or a quick drop after exercise, this lag can make the timing on your graph look slightly off. It does not mean the data is wrong. It just means the peak timing you see is approximate, not exact.
How SNAQ Helps You Read These Patterns
Logging meals alongside your CGM data is the fastest way to learn what works for your body. SNAQ connects directly to your CGM and lets you log meals by photo, voice, or barcode. Over time, you can see which meals produce smoother curves and which ones tend to run higher or longer.
The AI Coach can help you spot trends across weeks, not just single meals. Trend Insights show how often you're hitting your target range and which meal patterns tend to come with better stability.
SNAQ also includes photo-based carb estimation and voice logging to make the process quicker. These tools are not perfect, but they reduce the friction of manual logging and make it easier to build up enough data to see real patterns.
If You Don't Have Diabetes
If you're reading this because you saw a number on a friend's CGM or got tested once and want context, a rise after eating is completely normal. People without diabetes typically peak below 140 mg/dL and return to baseline within two hours. If you're concerned about a specific reading, talk to your doctor. This article focuses on patterns for people using CGM as part of diabetes management.
For more context on what different glucose numbers mean, see what does your blood sugar number mean.
Putting It Together
Start by logging a few meals and watching what happens over the next two to three hours. Notice when your peak arrives. Notice how long it takes to come back down. Notice which meals feel more predictable than others.
Patterns take time to appear. A single reading tells you very little. A few weeks of consistent logging tells you a lot.
If you want to start building that picture, download SNAQ to connect your meal with your CGM data.
References
- American Diabetes Association. Standards of Medical Care in Diabetes. Diabetes Care, 2021.
- International Society for Pediatric and Adolescent Diabetes. Clinical Practice Consensus Guidelines. Pediatric Diabetes, 2020.
- Monnier L, et al. Continuous Glucose Monitoring in Patients with Type 2 Diabetes: Why? When? And How? Diabetes & Metabolism, 2018.
- Jenkins DJ, et al. Carbohydrates, the Glycemic Index, and Heart Disease. Nutrition Reviews, 2022.
- Colberg SR, et al. Exercise and Type 2 Diabetes: American College of Sports Medicine and the American Diabetes Association Joint Position Statement. Diabetes Care, 2016.