Seeing a number on your CGM or meter can trigger instant worry. Is 86 okay? Should I be concerned about 110? The short answer is: it depends entirely on when you checked and which direction it is heading. Whether you saw 86, 103, or 118, the interpretation process is the same.
If you use a CGM, the most valuable thing you can learn is to focus on patterns across your day and week, not individual readings.
A quick note: This article is for informational and educational purposes only. If you have concerns about symptoms, frequent lows or highs, or medication changes, speak with your diabetes care team.
Is any single blood sugar reading good or bad?
The honest answer is that good or bad is the wrong frame. Whether a number is in a reasonable range depends on three things: when you measured it, which direction it is moving, and what was happening around that time.
A simple way to remember this is the TTC check: Timing, Trend, and Context. Run through those three before drawing any conclusions from a single reading.
For most nonpregnant adults managing diabetes, the American Diabetes Association's Standards of Care references a general pre-meal target of 80 to 130 mg/dL and a peak post-meal goal of under 180 mg/dL, but targets are always individualized. Your care team may set different goals based on your situation, medications, and risk factors.
For people without diabetes, the interpretation is different. Fasting levels in people without diabetes typically stay below 100 mg/dL, and post-meal levels rarely exceed 140 mg/dL, though ranges can vary by individual.
The sections below walk through what each number tends to mean at different times of day, and what to pay attention to instead of the number alone.
What your glucose number might mean by timing
Use this as a general reference. Targets are individualized, so treat these as context rather than personal goals.
| Timing | What the number might mean | What to check next |
|---|---|---|
| Fasting / on waking | Can fit the ADA general pre-meal target range of 80 to 130 mg/dL for many nonpregnant adults, though targets are always individualized. | Was it truly fasting? Is this repeating across mornings? |
| Pre-meal (before lunch/dinner) | Often consistent with ADA general pre-meal targets, though higher numbers warrant a closer look at the trend. | Check the trend arrow. Is this your usual pre-meal pattern? |
| After eating (post-meal) | Post-meal rises are expected. You may not have peaked yet. Or you are already past the peak. Timing is everything here. Many care plans use a peak post-meal goal of under 180 mg/dL. | How long since the meal? Rising or falling? Does it come back down over time? |
| During / after exercise | Could be stable or rising fast. Check the trend arrow first. This is when CGM lag tends to show up most. | The trend matters more than the number here. Watch the direction. |
| Bedtime / overnight | One reading at bedtime does not describe the full night. Your target range depends on your care plan. | Look for recurring overnight highs or lows. Discuss patterns with your care team. |
The TTC check: Timing, Trend, and Context
When a number surprises you, this three-step check puts it in perspective before you do anything else.
Timing
Fasting, pre-meal, post-meal, and bedtime readings are not interchangeable. Guidelines set different targets for each window, which is exactly why 110 can feel confusing in one situation and completely normal in another.
Trend
A stable 110 is different from 110 with a rising arrow. CGM was built to show direction and rate of change, not just a static number. The trend arrow is often more useful than the number itself.
Context
Meals, activity, stress, illness, sleep, and medications can all shift glucose. Before reacting to a reading, ask yourself what happened in the last 60 to 90 minutes.
Why one number is not the whole story
A single reading answers one narrow question: where am I right now? CGM's real strength is answering a much more useful question: what has been happening across my day and week?
Before reacting to any number, try these three questions:
- Is it going up, down, or holding steady?
- What happened before it? Recent meal, activity, sleep, stress, or illness?
- Is this pattern repeating across multiple days?
Better metrics to watch on CGM
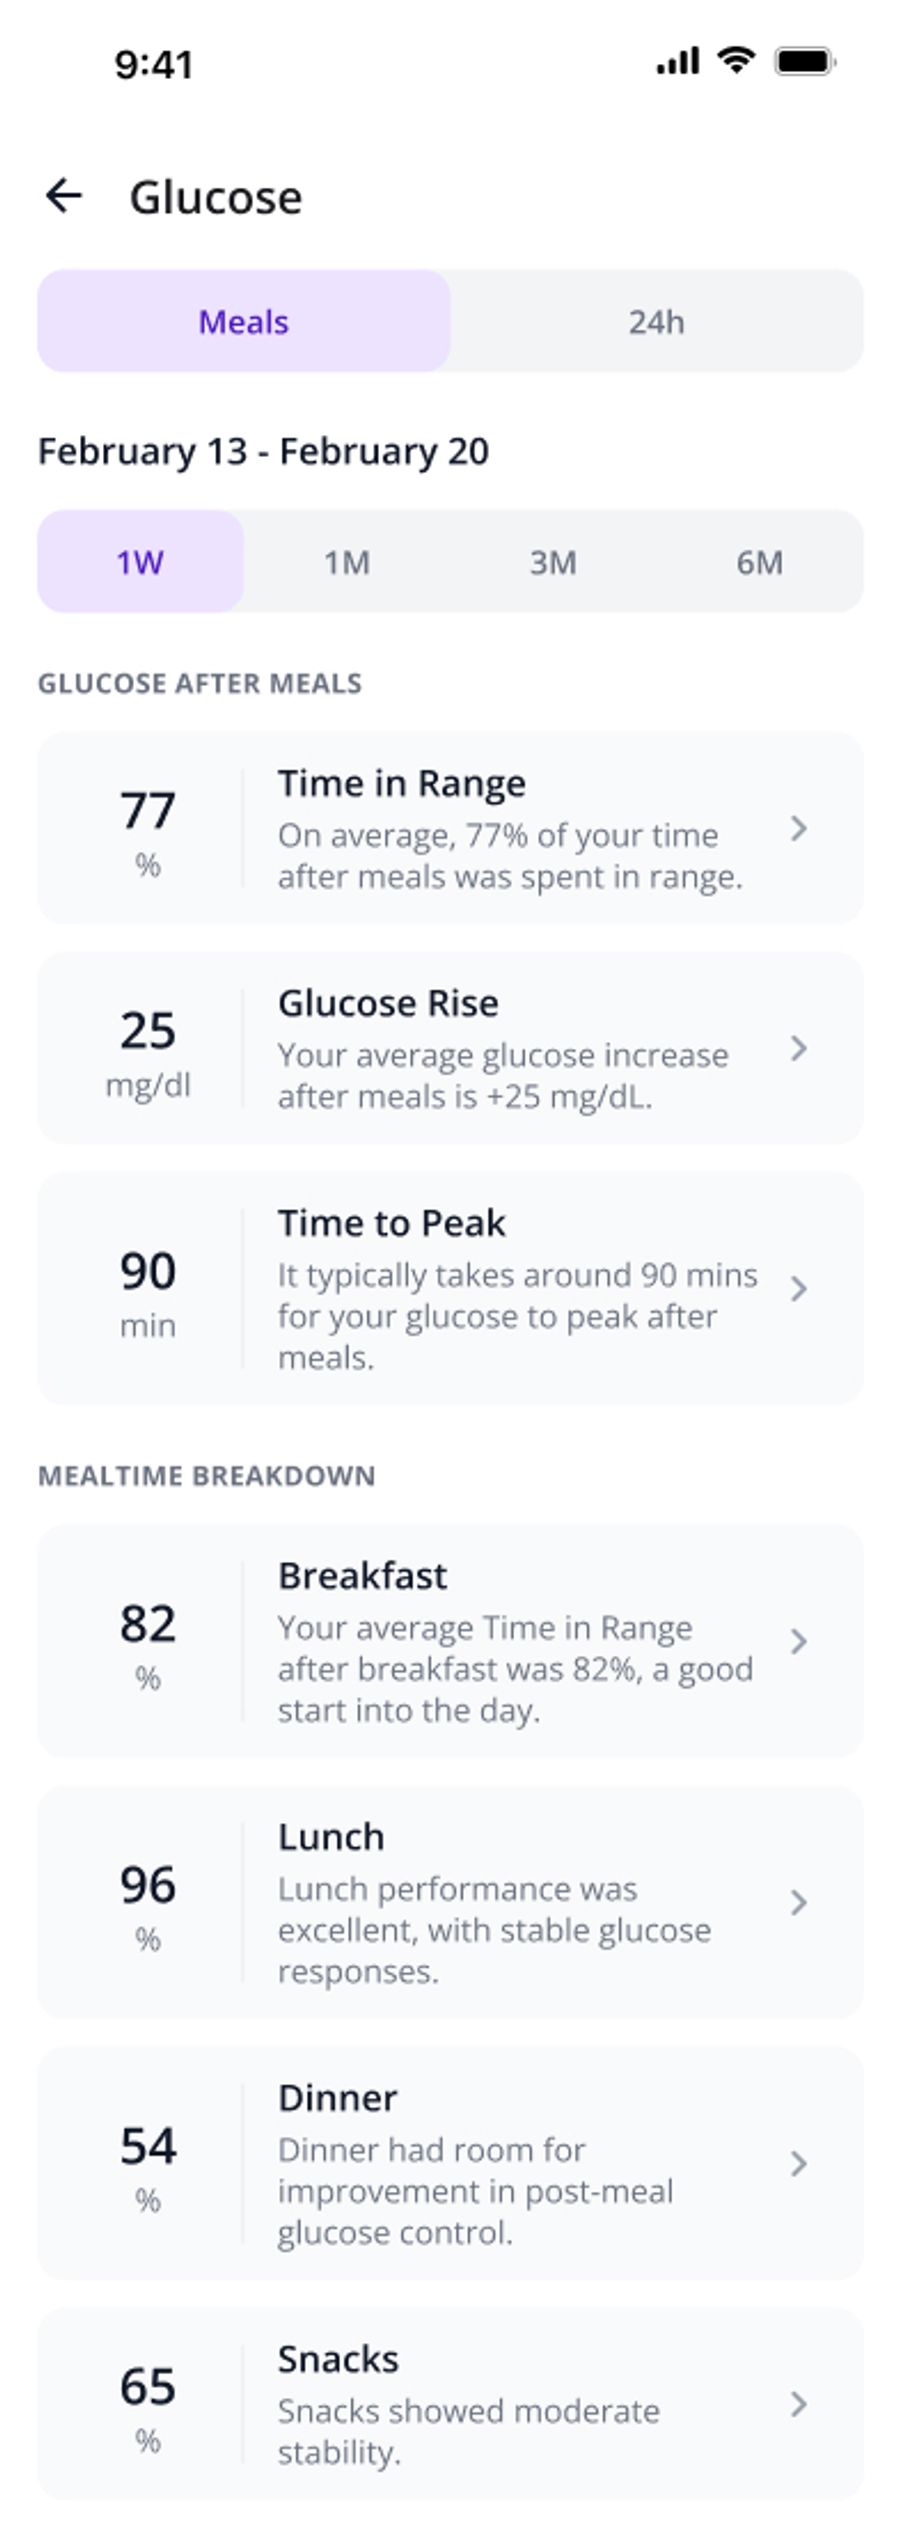
Time in Range (TIR). For many CGM users, in range means 70 to 180 mg/dL. A commonly referenced goal for many nonpregnant adults is spending more than 70% of time in that range, though this is individualized. SNAQ automatically surfaces your TIR alongside meal data, so you can see weekly and monthly trends without having to piece it together manually.
Time below range. Guidelines track time spent below 70 mg/dL and below 54 mg/dL because reducing time spent low is a major safety priority.
Glucose variability (%CV). International consensus guidance uses coefficient of variation as a standardized variability metric. A value at or below 36% is a commonly cited practical benchmark, though interpretation depends on the individual.
Glucose Management Indicator (GMI). GMI estimates your average glucose level over a period of time, similar to A1C but calculated from CGM data. It can be a useful way to track long-term trends without waiting for a lab test.
You can learn more about how GMI, TIR, and A1C compare in our comprehensive guide to glucose metrics.
How to read any glucose number: three examples
Scenario 1: 89 mg/dL fasting, flat trend
What it likely means: This can fit many care plans' general pre-meal targets, though targets are individualized.
TTC check: Fasting context, flat trend, no recent meal. Low urgency.
What to check next: Is this a consistent pattern across several mornings, or a one-off?
What matters more than the number: The repeat pattern at the same time of day, not whether it was 86 or 89 on one particular morning.
Scenario 2: 110 mg/dL with a rising arrow, 45 to 60 minutes after lunch
What it likely means: Post-meal rises are expected. Many plans use a general peak post-meal threshold of under 180 mg/dL, though peak timing varies.
TTC check: Post-meal context, rising trend, recent carbohydrate meal. Normal pattern in progress.
What to check next: Watch the full curve. How high does it go, and does it return toward your usual baseline? Logging the meal in SNAQ alongside your CGM curve makes this pattern easy to spot across multiple days.
What matters more than the number: The trend, the peak value, and how quickly it comes back down, not the fact that it passed through 110.
Scenario 3: 86 mg/dL with a downward arrow after a walk
What it likely means: The direction is the important signal here, especially with a downward trend after physical activity.
TTC check: Post-exercise context, falling trend. The trend is the story, not the number.
What to check next: Are you seeing recurring lows or meaningful time below range in your CGM summaries?
What matters more than the number: Time spent below range across multiple days, not this single reading.
In the moment vs over the week
These are two different questions, and keeping them separate helps reduce anxiety and improve decision-making.
In the moment
- Identify the timing: fasting, pre-meal, post-meal, or bedtime
- Check the trend direction (rising, stable, or falling)
- Recall what happened recently: last meal, activity, stress, illness, or sleep
- If you feel unwell, or if this reading is unusual for you, consider confirming with your care team before acting
Over the week
- Review your Time in Range
- Look for repeated spike patterns at the same time of day or with the same meals
- Watch the frequency and duration of lows, especially below 70 and below 54 mg/dL
- Note any consistent overnight trends
If you use a CGM, pairing the glucose curve with meal context is what turns numbers into understanding. Tools like SNAQ make that weekly review easier by overlaying your logged meals with your CGM data, so patterns become obvious rather than something you have to hunt for.
The 30-second takeaway
Timing changes meaning. A 110 before breakfast and a 110 an hour after lunch are two different situations.
Trend beats snapshot. On CGM, direction tells you what is coming next. A number without a trend arrow is half the picture.
Patterns beat moments. Time in Range, time below range, variability, and repeating scenarios tell you far more than any single reading.
When you see a reading that worries you, run the TTC check first: Timing, Trend, Context. Then zoom out to your week.
Ready to put this into practice? SNAQ connects your CGM data with your meals so the TTC check becomes automatic, and your weekly patterns are always one tap away. Download SNAQ on the App Store or Google Play.
Frequently Asked Questions
Is 86 blood sugar normal?
It depends on timing and context. Many care plans use different targets for pre-meal versus post-meal readings, and guidelines emphasize individualization. For most people without diabetes, 86 fasting would be considered within a typical range.
Is 89 blood sugar normal?
A single number needs timing and context to interpret. For many nonpregnant adults managing diabetes, the ADA references a general pre-meal target of 80 to 130 mg/dL, though targets are individualized. For someone without diabetes, 89 fasting is within a typical range.
Is 110 blood sugar normal?
It can be, especially depending on timing. After eating, glucose commonly rises. Many care plans reference a general peak post-meal goal of under 180 mg/dL for many nonpregnant adults. For people without diabetes, 110 after a meal is generally unremarkable, though individual responses vary.
What should blood sugar be 2 hours after eating?
Guidelines often describe a peak post-meal goal rather than a strict 2-hour target, since peak timing varies by person and meal. The ADA references a general peak post-meal goal of under 180 mg/dL for many nonpregnant adults.
What do the CGM trend arrows mean?
Trend arrows show the direction and speed of glucose change. The direction is often more actionable than the number itself, especially when you are eating or exercising.
What matters more than one glucose reading?
For CGM users, the zoomed-out metrics are usually more informative: Time in Range, time below range, time above range, and glucose variability. Apps like SNAQ can help by connecting your CGM data with meals, so weekly patterns become visible without manually piecing them together.
What is Time in Range and why does it matter?
Time in Range (TIR) is the percentage of time your CGM readings fall within a target window, commonly 70 to 180 mg/dL for many adults. The ADA includes TIR goals in its Standards of Care, with more than 70% referenced for many nonpregnant adults, alongside targets to minimize time spent low.
References
1. American Diabetes Association Professional Practice Committee. 6. Glycemic Goals, Hypoglycemia, and Hyperglycemic Crises: Standards of Care in Diabetes, 2026. Diabetes Care. 2026.
2. Battelino T, Danne T, Bergenstal RM, et al. Clinical Targets for Continuous Glucose Monitoring Data Interpretation: Recommendations From the International Consensus on Time in Range. Diabetes Care. 2019;42(8):1593-1603.
3. National Institute for Health and Care Excellence (NICE). Type 1 diabetes in adults (NG17): Checking your own blood glucose, and target levels. Updated 29 June 2022.
4. Raj R, Mishra R, Jha N, et al. Time in range, as measured by continuous glucose monitor, as a predictor of microvascular complications in type 2 diabetes: a systematic review. BMJ Open Diabetes Research and Care. 2022;10:e002573.
5. Association of Diabetes Care and Education Specialists (ADCES). Lag Time (CGM glossary). Updated 2022.
6. International Organization for Standardization (ISO). ISO 15197:2013(E): In vitro diagnostic test systems. 2013.
7. Freckmann G, et al. Analytical Performance Requirements for Systems for Self-Monitoring of Blood Glucose. Journal of Diabetes Science and Technology. 2015.
The SNAQ website does not contain medical advice. The contents of this website, such as text, graphics, images and other material are intended for informational and educational purposes only and not for the purpose of rendering medical advice. The contents of this website are not intended to substitute for professional medical advice, diagnosis or treatment. Please consult your healthcare professional for personalized medical advice.