Quick answer: A nutrition label describes the food, not what the food does in your body. It leaves out how fast the carbs digest, how much you actually poured, and how fat and protein shift the timing of a rise. Research using continuous glucose monitors has also found that different people can respond very differently to the same meal, which is something no label can print.
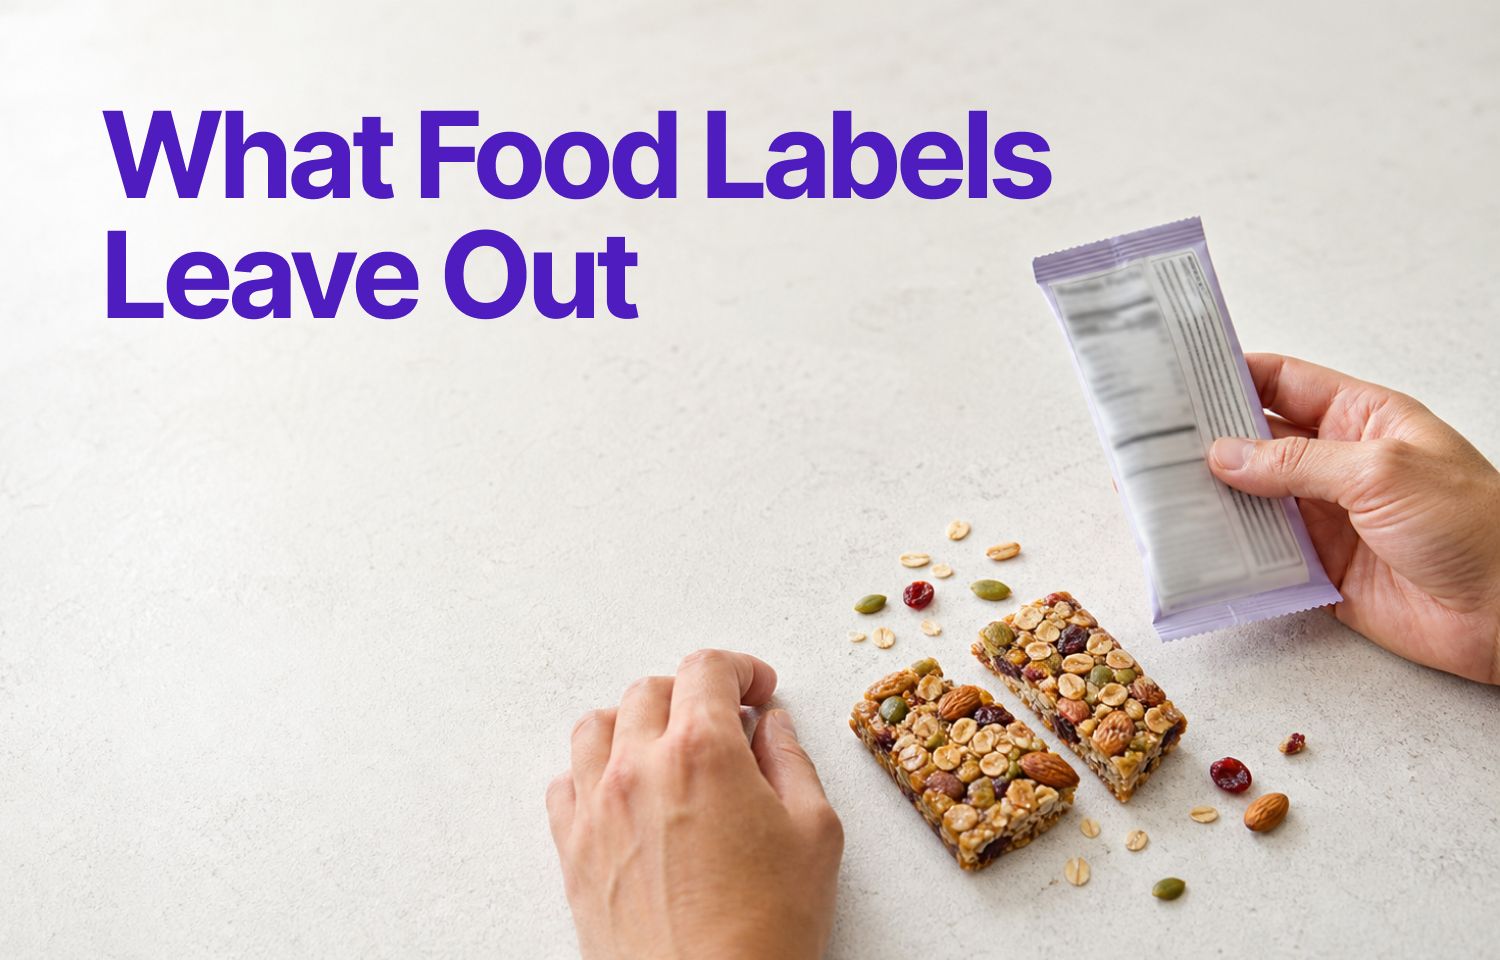
You're in the kitchen at 3pm with a granola bar that says "only 12g net carbs." Fine. That's a number you can work with.
Two hours later your CGM shows a climb you didn't order and a decline that takes the rest of the afternoon off.
The wrapper wasn't lying to you. Grams of carbohydrate, grams of sugar, a serving size decided in an office somewhere: all of it measured accurately, in a lab, months before that bar reached your hand. The panel answers a question about the food. You were asking a question about you.
The Label Shows Carbs, Not How Fast They Digest
Labels tell you how much. They say nothing about how fast.
Put white bread and steel-cut oats next to each other at the same carb count. The bread has been milled so fine that digestion barely has to show up for work. The oats arrive intact and have to be taken apart first. The panel says they're twins. Your afternoon disagrees.
Processing runs as a ladder, and once you notice it you can't stop noticing it. Steel-cut oats sit slower than rolled. Rolled sit slower than instant. By the time you reach instant you're most of the way to flour. Juice and whole fruit are that same ladder with the sugar content held constant, because fibre and intact cell walls do the slowing.
If two snacks with matching carb counts have ever given you completely different afternoons, this is usually where it started. Not you. The oats.
Learn more about why structurally similar carbs behave differently
The Serving Size Is Probably Not Your Serving
Check the serving size before the carb count. It's almost always smaller than people assume. A bag of chips says 15g per serving and holds two and a half. A juice bottle lists 20g of sugar for eight ounces and contains twenty.
That number has a legal origin most people never hear about. In the US, serving sizes are set against a reference amount for each food category, written into federal regulation at 21 CFR 101.12, describing what people typically eat in one sitting. Your bowl was not consulted.
The panel is rounded, too. Under 21 CFR 101.9, carbohydrate below 0.5g per serving can be printed as 0. For one serving that's nothing. For three servings a day of something you eat daily, it adds up quietly.
Granola, nut butters, dried fruit, trail mix. This is where portions drift furthest, and they drift for everyone. Restaurant and bakery items skip the label entirely, and a café muffin can run well past its homemade cousin with nothing on the counter to mention it.
See common scenarios where carb estimates break down
What "Low Sugar" Actually Tells You
"Low sugar." "No added sugar." "Lightly sweetened." Each one is a claim about a single ingredient. They describe sugar content and then they stop.
Sugar alcohols are the clearest example. Allulose and erythritol appear to do very little to glucose in most people. Maltitol is the one that catches people out, because it can raise glucose in some people while being subtracted out of the net carb figure printed on the very same packet. (Net carbs, if the term is new: total carbohydrate minus fibre and some sugar alcohols, on the theory that those parts don't get fully absorbed.)
So the sugar-free cookie might be genuinely gentle. It might also be flour and starch in a costume.
The Ingredient List Tells You More Than the Front of the Package
Ingredients run in descending order by weight, which makes the first five lines the most honest text on the package.
Watch for one thing wearing several names. Cane syrup, dextrose, maltose and fruit juice concentrate can share a single product, each small enough on its own to look harmless, together doing something else entirely. Maltodextrin is the one to learn on sight: a processed starch used as thickener or filler, classed separately from sugar on the label, and capable of moving glucose fast.
"Whole grain" and "multigrain" both live happily on products whose first ingredient is refined flour. Several sugar or starch sources near the top usually means a bigger rise than the carb line let on.
Why a Perfect Label Would Still Miss You
Everything up to here is a gap in how the food gets described. A better label could close most of it.
This one it can't.
In 2015 a team at the Weizmann Institute went and measured it.
Same meals. Very different curves.
Zeevi et al., Cell, 2015
People eating identical food showed high variability in how their glucose responded. The authors put it plainly: universal dietary recommendations may have limited utility. Carbohydrate counting on its own predicted an individual's response considerably worse than a model built from that person's own data.
Sit with that one, particularly if you've ever felt like you were failing at something everyone else had worked out. A nutrition panel is a fact about a food. Measured once, printed on every unit, identical for everyone who picks it up. Your response is a fact about one meal, on one day, in one body, and no printing press can reach it.
Fat and Protein Change When the Rise Happens
Fat slows how fast food leaves your stomach. That doesn't shrink the curve. It moves it.
The everyday version of this advice undersells what actually happens. A 2015 systematic review in Diabetes Care went through the studies on fat, protein and glycemic index in type 1 diabetes and found the dominant effect of dietary fat was a late rise, hours after eating. In several of those studies glucose ran lower than expected during the first two to three hours.
Which matters a lot if two hours is when you look. A high-fat meal can seem completely settled at the check, then climb once you've stopped paying attention. Pizza. Curry with cream. A cheese-heavy pasta. Same carbs as the plain version, entirely different schedule.
Protein adds a smaller, later rise of its own, more noticeable in bigger portions. The two stack.
So when a curve doesn't match the carb count, look at the timing before you look at the height. And anything you'd want to change about how you handle it belongs in a conversation with your care team, not in a blog post.
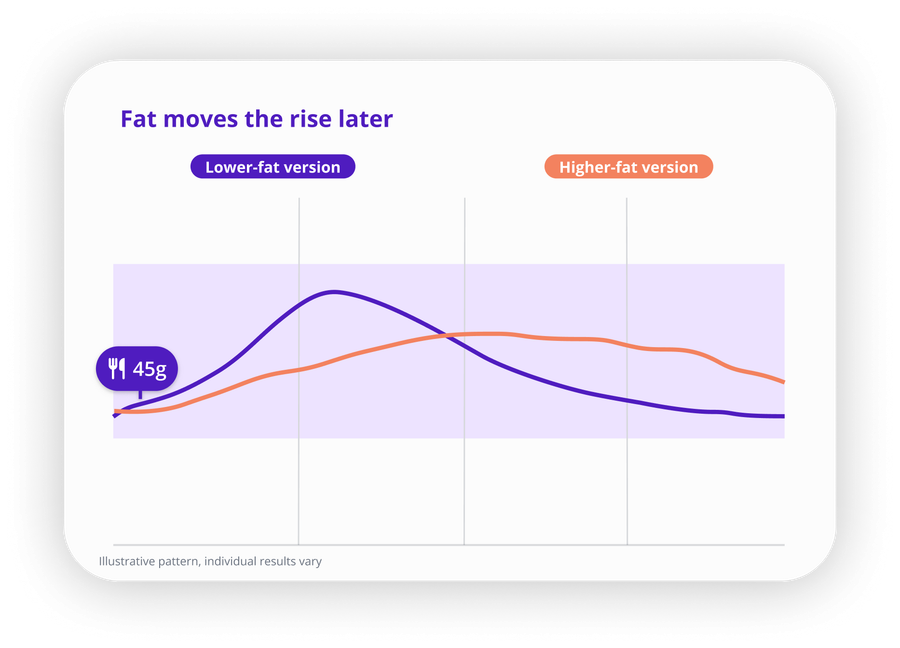
Same 45g of carbs, two different schedules. Illustrative pattern, individual results vary.
Glycemic Index Is a Population Average
Glycemic index ranks how fast a food raises blood sugar against pure glucose. Glycemic load adjusts that ranking for the portion you actually eat, which makes it the more useful of the two. Neither shows up on a standard label.
Both carry the same asterisk. GI values come from groups of test subjects, under controlled conditions, averaged. Jenkins, whose team introduced the idea in 1981, has spent four decades describing it as a way to classify carbohydrate foods across populations.
So a low-GI food can still give you a sharp rise, and when it does, nothing has gone wrong. Averages do what averages do.
What to Do With a Label You Can't Fully Trust
Read the panel in order. Serving size, then carbs, fibre, fat, protein. Scan the first five ingredients for refined grains, syrups and starches. Treat GI and GL as an opening guess.
Then check the food against your own curve, and check it more than once. One meal is one data point, collected on one day, under conditions you probably weren't tracking: how you slept, what you did that morning, what else was on the plate. Two or three logs of the same food will tell you more than one very careful log ever will.
Which means the goal isn't a perfect log. It's a repeated one. Brand, portion, time, and whatever else you ate. That last one catches more people out than everything else combined.
And if you've been reading labels carefully for years and still getting surprised, that isn't a discipline problem. The label was never going to have that information.
| Question | Does the label answer it? | Where the answer actually comes from |
|---|---|---|
| How many carbs are in it? | Yes, for the listed serving, rounded to the nearest gram. | The panel. Check the serving size line first. |
| How fast will those carbs digest? | No. | Processing clues in the ingredient list. Refined flour, syrups and starches near the top suggest a faster rise. |
| How much am I actually eating? | Only if your portion matches the reference serving, which it often does not. | Weighing or measuring while you learn what portions look like. |
| Is "low sugar" going to be gentle? | No. That claim covers one ingredient. | The full ingredient list, including sugar alcohols and starches. |
| When will the rise happen? | No. | Fat and protein content shift the timing. Your own logged curves show the pattern. |
| What will this do to me specifically? | No, and it never can. | Repeat logs of the same food, reviewed alongside your CGM data over time. |
This is the part SNAQ was built for. Log a meal with a photo or a voice note, let SNAQ estimate the nutrition, then set it next to your CGM curve. Do that a few times with the same food and you stop interpreting somebody else's label and start reading your own history. Download SNAQ.