Quick answer: A prediabetes result means one or more of your glucose tests came back above the normal range and below the threshold for type 2 diabetes. Which test flagged you changes what the result means, because A1C, fasting glucose, and the oral glucose tolerance test measure different things and find different people. Start by getting your exact number, the test that produced it, and whether your clinician wants it repeated.
A prediabetes result is a signal, not a countdown
Most people find out through a patient portal notification, halfway through a Tuesday: one word, no context, and a follow-up appointment three weeks out.
The first useful thing to know is that you have time. Prediabetes sits below the threshold for type 2 diabetes, and it tends to move slowly. Everything worth doing here can be done at a walking pace. The urge to fix it all by Sunday is completely understandable, and it usually works against you. The second useful thing is that you are in very ordinary company, since the CDC puts prediabetes in more than 2 in 5 US adults.
A prediabetes result is real information. What it leaves out is how likely you are to end up with type 2 diabetes, and that gap is wider than most people assume. Two people can get the same word on the same day and be in completely different positions: one with an A1C of 5.7 percent and everything else in range, the other with a fasting glucose of 124 mg/dL that has been climbing for three years and a parent with type 2. They come away with the same label describing two quite different situations.
Plenty of people read the result as a report card on how they have been living, when it works better as a weather reading: conditions, measured once, at one moment, by one instrument. Which instrument turns out to matter quite a lot.
Find out which test put you there
Three tests are used in the US to spot prediabetes, and each one is looking at something different.
A1C estimates your average glucose exposure over roughly two to three months, from a single blood draw with no fasting required. It is an average, and averages are lazy narrators: a calm month and a chaotic one can land on the same number.
Fasting plasma glucose (FPG) catches a single moment, after at least eight hours without food, which makes it a snapshot taken at the quietest point in your day.
Oral glucose tolerance test (OGTT) is the pushy one. You drink 75 grams of glucose and give blood two hours later. It stresses the system on purpose to see what happens.
| Test | What it measures | Prediabetes range | Type 2 diabetes |
|---|---|---|---|
| A1C | Average glucose exposure over roughly the past two to three months. No fasting needed. | 5.7% to 6.4% | 6.5% or higher |
| Fasting plasma glucose (FPG) | Glucose at a single moment, after at least eight hours without food. | 100 to 125 mg/dL | 126 mg/dL or higher |
| Oral glucose tolerance test (OGTT) | How your body handles a standard 75 g glucose drink, measured two hours later. | 140 to 199 mg/dL | 200 mg/dL or higher |
Those thresholds are American, set by the American Diabetes Association. Other countries draw the lines elsewhere. UK guidance, for instance, treats 6.0 to 6.4 percent as the A1C prediabetes range. If you were tested outside the US, check which set your clinician used.
Before the details fade, write down four things: your exact number, which test produced it, whether older results show a trend, and whether your clinician wants a repeat.
A1C also has a quirk that matters here. Because it measures something attached to your red blood cells, anything that changes the life of those cells changes the number: severe anemia, recent blood loss or a transfusion, kidney or liver disease, pregnancy, some inherited blood disorders. If your A1C sits oddly next to your glucose readings, that is a conversation with your care team rather than a verdict on your last three months.
Two people with prediabetes can be in very different situations
The three tests find different people, and the overlap between them is only partial, which is the part that usually gets left out. ADA's Standards of Care say it in plain language: the cut points for these tests identify groups with incomplete concordance. Someone flagged by A1C can have a completely ordinary fasting glucose. Someone flagged by OGTT can have an A1C that looks fine.
Why the test matters
The test used changes who gets identified
Each circle is a group of people flagged as prediabetes by that test. The circles overlap, and they do not agree completely.
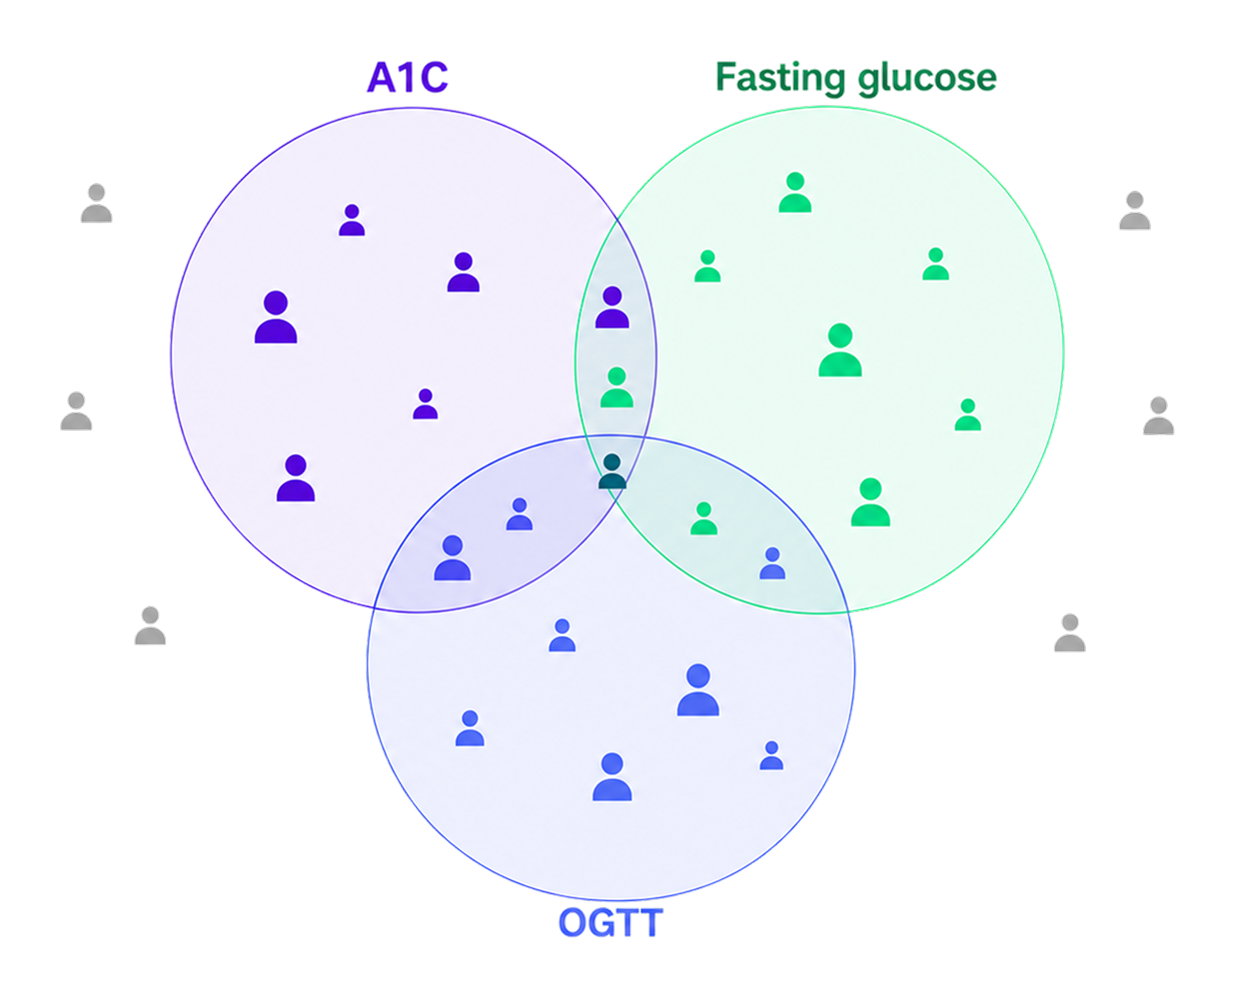
Where circles overlap, more than one test came back abnormal. That generally points to higher risk than a single abnormal result. Where they do not overlap, someone flagged by one test may be completely normal on another. The grey figures outside are people no test flagged.
Illustrative only. The figures are examples, not proportions, and the circles are not drawn to scale. Real-world overlap between the tests varies by population, age, and ethnicity. Based on ADA Standards of Care in Diabetes, which note that the diagnostic cut points for these tests identify groups with incomplete concordance.
Two things generally push risk up. Sitting closer to the diabetes threshold, and having more than one test come back abnormal. A number at the bottom edge of the range and a number just under the diabetes cut point both get called prediabetes, and they describe different situations.
Position in the range
Prediabetes is a band, not a single point
A result at the bottom edge of the range is not the same situation as one just under the diabetes threshold. Both get called prediabetes. Where you sit in the band, and whether more than one test is abnormal, both affect what the result means for you.
US thresholds, based on American Diabetes Association criteria. Bars are schematic and not drawn to numerical scale. The cut points are diagnostic boundaries, not personal targets. Your clinician interprets your result alongside the rest of your health picture.
It also changes how to read the most quoted number in the field. The Diabetes Prevention Program found that intensive lifestyle change cut the incidence of type 2 diabetes by 58 percent over about three years, against placebo. That is a real result from a well-run trial, and it deserves the attention it gets. It was also a relative reduction, measured in one specific group: adults with impaired glucose tolerance identified by OGTT, who also had overweight or obesity.
ADA say this out loud in their current Standards. The evidence for preventing type 2 diabetes comes mainly from people with impaired glucose tolerance, rather than from people with raised fasting glucose alone or prediabetes defined by A1C alone.
So if you have been carrying that 58 percent figure around as a personal forecast, you can set it down: it came from a trial run in a narrower group than the headline suggests. Lifestyle change still helps, but the number belongs to a different set of people than the internet implies.
What to ask at your next appointment
Risk scoring is your clinician's job, and they are better equipped for it than any article. What helps most is arriving with better questions.
- How close is my result to the diabetes threshold?
- Was more than one test abnormal?
- Has this number been rising across my previous results?
- Should the test be repeated to confirm it?
- Do my blood pressure, triglycerides, liver results, or waist measurement change the picture?
- Could anything else be contributing, like sleep apnea, PCOS, or a medication I am on?
- I have a history of gestational diabetes. Does that change anything here?
- Is weight loss medically appropriate for me?
That last one matters more than people expect. Prediabetes turns up in people who are lean, and advice built entirely around weight loss misses them completely. It is also the question most likely to get skipped in a ten-minute appointment, so ask it early.
Pick one change, not five
Standard prediabetes advice arrives as a five-item assignment. Eat better, move more, lose weight, sleep more, stress less. Every item has evidence behind it, and taking on all five at once is a lot to ask of anyone.
Treat it as a menu. Pick one and let it settle in before you add another. Start where your gap is biggest.
If you barely move, walk. The ADA and the American College of Sports Medicine put the target at 150 minutes of moderate activity a week, which works out to 30 minutes on five days. Moderate means brisk walking, easy cycling or swimming, at the pace where you can still hold a conversation, badly. Resistance work earns its place too, because muscle tissue burns through glucose, so keeping or building some can improve how your body handles it over time. Activity also improves insulin sensitivity, meaning how readily your cells take glucose out of your blood when insulin tells them to.
If sugary drinks or refined snacks run your afternoons, start there. Usually the easiest single change to make, and the one that tends to show up fastest.
If your meals are low in fiber, fix the repeat offenders. The breakfast you eat five days a week deserves more attention than one dinner out. Whole grains more often, more non-starchy vegetables, some protein or fat sitting alongside the carbs. Carbohydrate-rich foods also behave very differently from each other, which is worth understanding before you start banning things. More on that in why simple carbs don't always behave the same.
If weight loss is medically appropriate for you, aim modest. The CDC puts modest at 5 to 7 percent of body weight, roughly 10 to 14 pounds for someone at 200. The DPP lifestyle group aimed for at least 7 percent, and slow is fine: the version you can still be doing in a year beats the version that photographs well in month two.
If your sleep is short most nights, that counts as a lever too. Chronic short sleep can affect how your body handles glucose the next day, and it quietly makes every other change harder to hold onto. For most people, regular timing helps more than chasing a total.
When structured support is worth asking about
Doing this alongside someone helps a lot of people. CDC-recognized diabetes prevention programs pair you with a trained coach and a set structure, which exists because DPP-style intervention works better with scaffolding around it.
Prevention guidelines also describe metformin as an option worth considering for some adults at higher risk. Guidelines frame it as a risk-based decision that sits alongside lifestyle change. Whether it fits you belongs in a conversation with your clinician.
What is worth tracking, and what probably is not
The main feedback loop here is a repeat lab test, at an interval you agree with your clinician. Most of the rest is optional.
Ask what interval fits your situation. Some people get retested at three to six months, others annually. What makes sense for you depends on your result, your risk, and what you are changing, which is why it belongs in a conversation with your clinician.
Between tests, the most useful thing to watch is the behavior you picked: walks done, resistance sessions, drinks swapped, breakfasts improved, sleep held roughly steady. Those are things you control, and they answer the question "am I doing the thing" without letting a glucose number deliver a daily verdict on your character.
On checking glucose at home
Diagnosis comes from a lab, and while a home meter measures something real, it sits outside the process that put the word on your chart. Daily fingersticks are also not standard practice for prediabetes, and for some people they trade clarity for anxiety. Occasional checks can earn their keep when you have one specific question in mind. If you want to try it, ask your clinician what would actually tell you something useful.
On CGM
A continuous glucose monitor (CGM) is a small sensor worn on the body, reading glucose in the fluid just under your skin every few minutes, so you get a curve instead of dots.
A few things worth knowing before you buy one:
- A CGM does not diagnose prediabetes. Lab tests do.
- Managing prediabetes without one is entirely normal.
- Evidence for CGM-guided prevention in people without diabetes is still thin.
- One peak after one meal says very little about whether a food suits you.
- Diabetes care has established glucose targets. Prediabetes has no consumer CGM equivalent.
If you want to understand what the different glucose numbers actually mean before deciding anything, our comprehensive guide to glucose metrics covers A1C, time in range, and how they relate.
Where a food record actually helps
The genuinely hard thing to do from memory is see your own patterns. Most people carry a rough idea of what they eat alongside a completely different actual diet, and the gap only shows up once a week of it is sitting in front of them.
A short, focused logging period beats open-ended tracking, so pick one question: what is actually in my usual breakfast, or where is most of my fiber coming from. Photograph that one meal for a week or two, then read the pattern instead of grading individual meals.
SNAQ is built for that. You photograph the meal and it estimates the carbs, protein, fat and fiber, so the database typing goes away, and you can add notes about timing or context alongside it. If you already wear a CGM, SNAQ can sit the meal context alongside the curve so the review makes sense. The point is to arrive somewhere with something concrete: a dietitian, a clinician, or just yourself on a Sunday evening. Learn more about SNAQ.
One caveat we will put in writing: SNAQ's published outcomes come from people with type 1 diabetes. That tells you something about logging and nothing about reversing prediabetes, and we would rather say so than let the two blur. What a food record does is make the food part visible, so the change you pick reflects what you actually eat.
Four things people get wrong about prediabetes
"I need to cut out all carbs."
Portion size and processing do most of the work here: a big serving of refined carbs can drive a steep rise, while the same gram count from something with fiber in it often behaves quite differently. Higher-fiber choices, sensible portions, and some protein or fat alongside will get you most of the way. You get to keep bread.
"This means I am getting type 2 diabetes."
Your result alone cannot say. Progression varies with which test flagged you, how close you sit to the threshold, whether more than one test was abnormal, and what happens next. Some people move back into the normal range, and some sit where they are for years.
"Exercise only counts if I lose weight."
Activity can improve insulin sensitivity whether or not the scale cooperates. Plenty of people put in three solid months, see a flat weight, and wonder whether any of it counted. It counted. A bathroom scale is simply poor equipment for measuring it.
"I can fix this in a month."
A1C reflects two to three months of glucose exposure, so three weeks of effort will show up as a whisper. Retesting too early can make the same effort look like nothing at all. Given a full interval it usually reads quite differently, which means patience is doing real work here.
Your first week
Nothing here needs a transformation, just six things, and most of them are admin.
- Get your exact result and the test that produced it. Write it down where you will find it again.
- Dig out older results to compare it against.
- Save the questions above for your next appointment.
- Pick one change. One. The one matching your biggest gap.
- If you want to understand your food, start photographing one repeated meal.
- Agree a retest date with your clinician.
None of that has to happen this week. Get the number, pick the one change you can actually keep, and give it long enough to show up on a test. Your care team can help you read what comes back.