Quick answer: Alcohol makes glucose curves hard to read because your liver pauses its normal glucose release to process the alcohol first, often causing an unexpected drop hours later regardless of what you ate. Add in how wildly carb content varies between drinks, and a curve after drinking rarely matches your usual pattern for the same meal. Logging alcohol as its own variable, separate from food, is the most reliable way to keep your data readable.
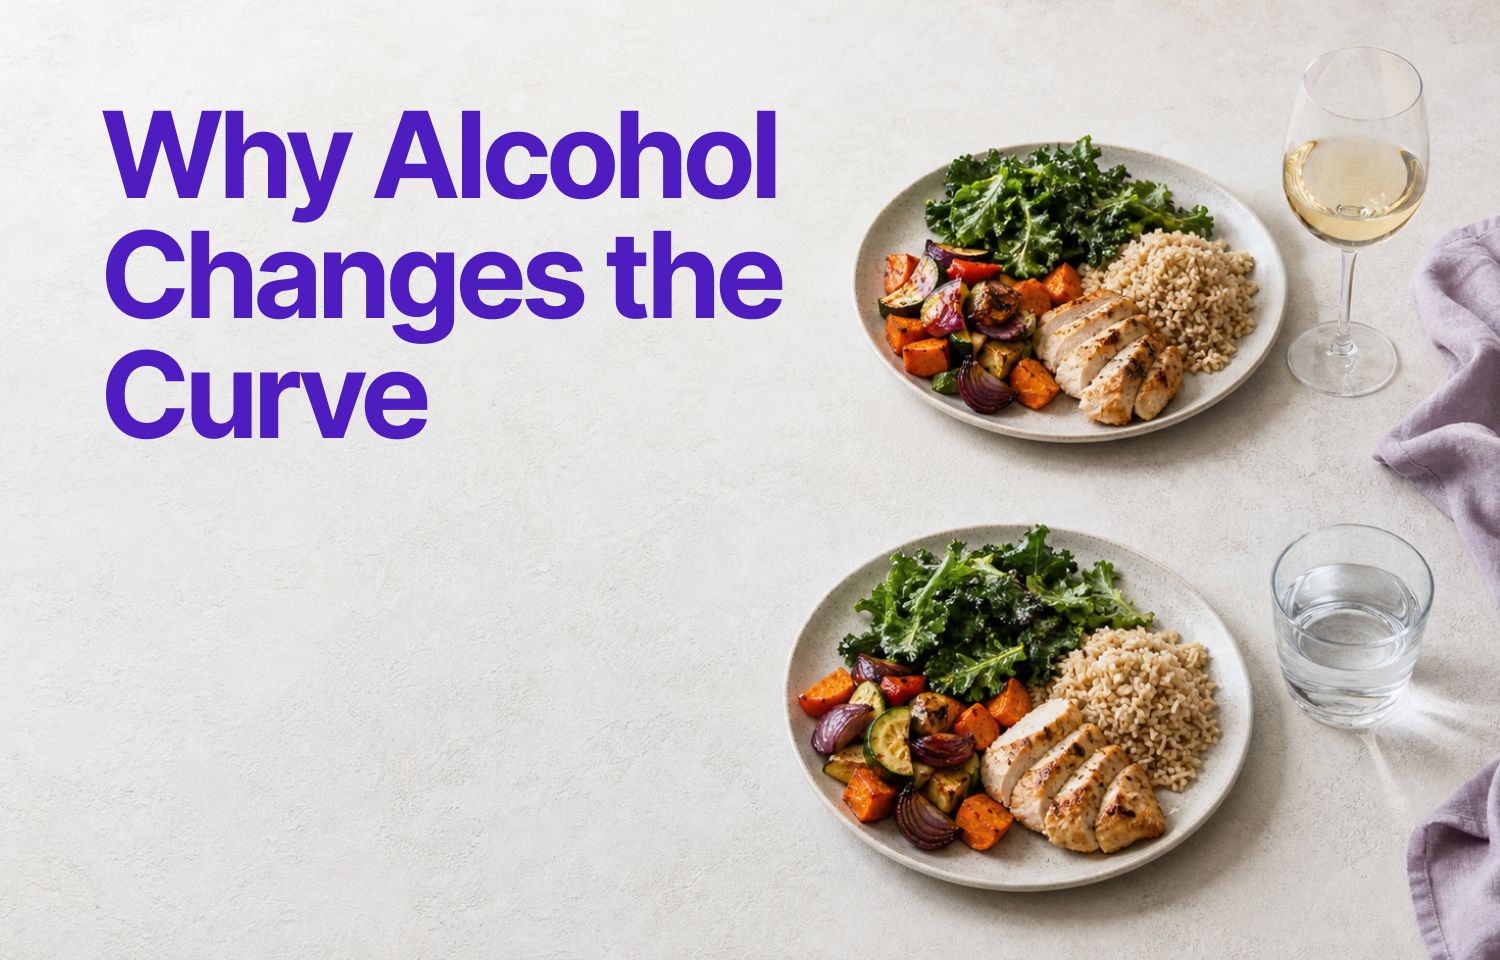
One glass of wine added to a meal you've logged a dozen times, and the curve that comes back isn't the one you know.
Alcohol doesn't just add carbs or delay digestion. It changes how your liver behaves, and that makes CGM data harder to interpret for hours afterward.
The Liver Problem
Most glucose-related advice centers on carbs, timing, and activity. Alcohol is different because it shifts the liver's priority.
Normally, your liver releases glucose steadily between meals and overnight. When you drink, your liver pauses that process to break down alcohol first. That can drop glucose unexpectedly, especially several hours after drinking.
At the same time, if your drink contains sugar or you eat a carb-heavy meal alongside it, glucose may spike normally at first. Then it drops later when the liver is still occupied. The result is a curve that looks erratic, with a rise you expected and a fall you did not.
Why the Curve Gets Messy
A vodka soda and a margarita aren't running the same experiment on your glucose. One has almost no carbs. The other can carry 20 to 40 grams, enough to cause its own spike before the liver effect even enters the picture. What's in the glass matters as much as how much you drink.
Food changes the outcome too: protein and fat alongside a drink slow alcohol absorption and soften the glucose drop, while an empty stomach raises your hypoglycemia risk. Your own metabolism adds a third variable, since how fast your liver clears alcohol depends on body weight, genetics, sex, and how often you drink. That's part of why the same two drinks can land differently on different nights.
Even a stable night doesn't guarantee a clean morning. Higher fasting glucose the next day is common, especially after more than one or two drinks.
Put all of that together and a new food tested on a drinking night is an experiment you can't really read. The liver effect adds too much noise to isolate what the food alone did.
If You Take Insulin or a Sulfonylurea
The delayed low described above is more than a data quirk if you're on insulin or a sulfonylurea (glipizide, glimepiride, glyburide, and similar). The American Diabetes Association's 2026 Standards of Care specifically calls out alcohol-related delayed hypoglycemia as something people on these medications should watch for, recommending extra glucose checks after drinking rather than relying on how you feel. If that's you, this is a conversation for your care team, not something to work out from a CGM graph alone.
If you're not on one of these medications: the liver mechanism above still happens, alcohol still pauses your glucose output, but the stakes are different. You're untangling a confusing graph, not managing a safety risk. The rest of this article is about keeping that untangling accurate.
What to Log
When you drink, treat it as a separate variable. Log the type of alcohol, approximate amount, what you ate with it, and the timing.
Over time, you may notice whether certain drinks or combinations are more stable for you. That is useful. But do not expect the same level of pattern clarity you get from logging meals without alcohol.
For strategies on interpreting glucose curves after meals with clearer patterns, check the linked guide.
Practical Strategies
You don't need to cut out alcohol to use a CGM well. You need to work around the liver interference, and most of that comes down to timing and a healthy skepticism toward any single curve.
Food is the biggest lever here. Eating protein, fat, and some carbs before or during drinking slows alcohol absorption and meaningfully lowers your hypoglycemia risk, more than almost anything else on this list.
A couple of smaller habits help too. If your CGM supports custom alerts, a lower low-glucose threshold on drinking nights adds a layer of overnight awareness. Checking your glucose once more before bed, even when dinner looked fine, gives you one more data point, and a downward trend is worth flagging to your care team, especially if it's not a one-off.
The bigger mistake is reading too much into a single curve. If a post-alcohol reading looks off, check what you drank before blaming the food, and test that same meal again sober before drawing any conclusions. The same logic runs in reverse: a rough morning after drinking usually traces back to the drink, not to whatever you had for breakfast.
For background on factors that affect CGM accuracy and glucose variability, the linked article covers broader context.
The Comparison Problem
One of the most useful CGM skills is comparing the same meal across different days. Alcohol disrupts that.
If you drink on Monday and eat the same dinner Tuesday without alcohol, the curves won't match. The liver variable changed, not your body's response to the meal.
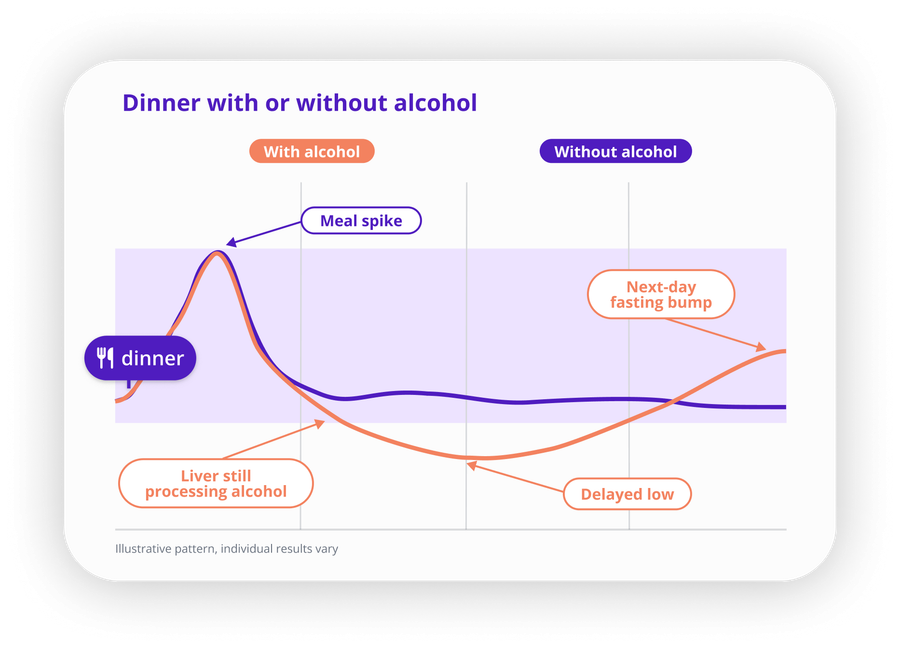
Illustrative pattern, individual results vary.
A Note on Sugary Mixers and Beer
Not all drinks are equal. Clear spirits with sugar-free mixers cause the liver effect but add almost no carbs. Sweet cocktails, regular beer, and dessert wines add both the liver effect and a glucose spike.
If you are trying to reduce post-drink glucose swings, the mixer and drink type often matter more than the alcohol volume itself.
Examples:
- Vodka soda: minimal carbs, liver effect still present.
- Margarita: 25 to 40 grams of carbs depending on size, plus liver effect.
- Dry wine: 3 to 5 grams of carbs per glass, moderate liver effect.
- Regular beer: 10 to 15 grams of carbs per bottle, liver effect present.
- Sweet cocktail with juice: 30+ grams of carbs, strong liver effect.
The carb load drives the immediate spike. The liver effect drives the delayed low or the next-day fasting-glucose bump.
Using SNAQ to Keep Context Clear
SNAQ does not prevent alcohol from complicating your glucose data, but it can help you keep the timeline clear.
When you log a drink alongside your meal, the app places both on your glucose curve. Later, when you review the week, you can see which curves had alcohol and which did not. That makes it easier to filter out noisy days when you are looking for food patterns.
SNAQ also supports voice logging, so you can quickly note "glass of wine with dinner" without interrupting the evening. The goal here isn't flawless tracking, just enough context that your data still makes sense later.
If you drink occasionally and want your glucose data to stay useful, tagging it takes a few seconds and saves you from second-guessing a confusing curve later. Download SNAQ.