If you are looking at a glucose reading and wondering whether it is normal, start with two questions: when did you check, and do you have diabetes? Blood glucose rises and falls all day. A fasting result cannot be read the same way as a number taken an hour after lunch or straight after a workout.
The ranges below are general reference points for nonpregnant adults. They are not a diagnosis and not a personal treatment plan. It also matters where the number came from, because a laboratory test, a fingerstick meter and a continuous glucose monitor (CGM) measure glucose in different ways.
Blood Sugar Metrics
You will see several different blood sugar metrics in a lab report, a meter or a CGM app. Each one answers a different question:
- Fasting glucose: Your glucose after at least eight hours without calories, usually measured when you wake up.
- Pre-meal or baseline glucose: Your reading shortly before eating. It gives you the starting point you need to make sense of the rise that follows.
- Post-meal glucose peak: The highest point after a meal. It often lands within one to two hours, though meal composition and individual physiology can move it earlier or later.
- Mean 24-hour glucose: Your average across a full day. A CGM can estimate this from repeated sensor readings.
- A1C: A laboratory measure reflecting average glucose exposure over roughly two to three months.
- Time in range: The percentage of time glucose stays within a defined range. The range has to be stated alongside the percentage, because "time in range" means nothing without its upper and lower limits.
One number rarely gives you the full picture. Fasting glucose, post-meal peaks, daily averages, A1C and time in range each describe a different part of the same pattern.
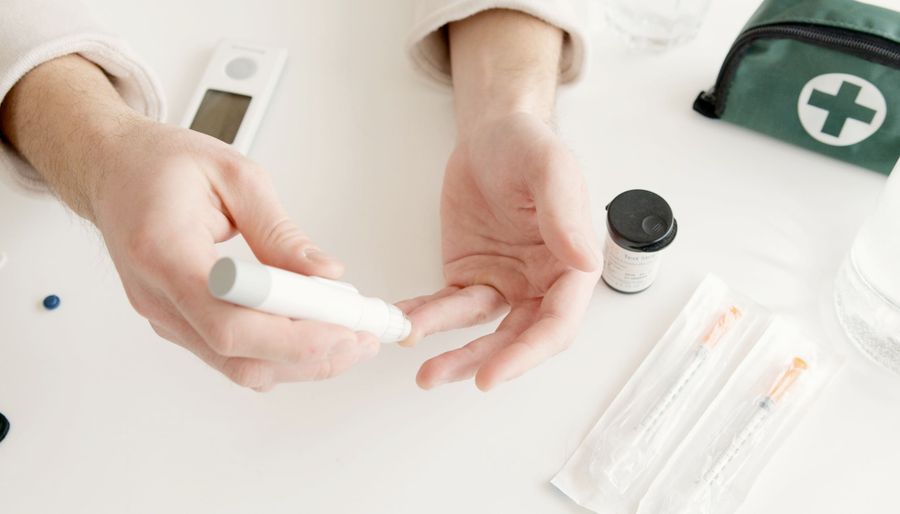
What Affects Blood Glucose Levels?
Two people can eat the same meal and see different results. The same person can eat that meal on two different days and see different results. Common reasons include:
- Diabetes. Type 1 and type 2 diabetes change how the body produces or uses insulin, which changes how glucose is regulated.
- Carbohydrate amount and form. These usually drive the largest immediate rise. Fat, protein and fiber can change both how high glucose climbs and when it peaks.
- Meal timing. The same meal may produce a different curve at breakfast than at dinner. Eating late can affect overnight glucose for some people.
- Medication. Insulin and other medicines raise or lower glucose. Any decision about them belongs with your healthcare professional.
- Exercise. Moderate activity often lowers glucose, because working muscles take up more of it. Intense exercise can push it up briefly as stress hormones release stored energy.
- Sleep and stress. Poor sleep and psychological or physical stress can reduce insulin sensitivity and leave glucose running higher.
- Illness. Infection, inflammation, dehydration and some medicines used during illness can make readings higher or simply less predictable.
- Measurement conditions. A CGM reads glucose in the fluid under the skin and can lag behind blood during rapid changes. Fingerstick results can be thrown off by technique or by residue on your hands.
What is a normal blood sugar after exercise for a non-diabetic?
There is no separate official "after exercise" range for people without diabetes. Glucose may drop during moderate activity or climb briefly after something intense. What matters more is whether the reading settles back toward your usual pattern, and whether an unusual result repeats. One raised number after a hard session does not on its own indicate diabetes.
Normal Blood Sugar Levels For People Without Diabetes
For adults without diabetes, a fasting laboratory glucose below 100 mg/dL sits below the prediabetes threshold, and a common fasting reference range is roughly 70–99 mg/dL. In a standardized oral glucose tolerance test, a two-hour result below 140 mg/dL is considered normal.
Those are laboratory thresholds. They were never meant to act as ceilings for every ordinary meal or every CGM reading. The chart below separates the established clinical reference points from the research observations, because the two get mixed together often.
| Metric or testing window | General reference for adults without diabetes | What it tells you |
|---|---|---|
| Fasting glucose | 70–99 mg/dL | A laboratory fasting result of 100–125 mg/dL falls in the prediabetes range. |
| Pre-meal glucose | Usually close to fasting, commonly 70–99 mg/dL | Daytime averages in healthy CGM cohorts run about 93–100 mg/dL. There is no separate diagnostic cutoff for every pre-meal reading. |
| Immediately after eating | Usually still near your pre-meal value | Peaks typically arrive about 45–60 minutes after the first bite, so an immediate check catches the rise before it has happened. |
| 1 hour after eating | Often at or near the peak, commonly 120–140 mg/dL | From CGM studies in healthy people, where the 10th to 90th percentile ran from roughly 116 to 174 mg/dL. No diagnostic one-hour cutoff exists for an ordinary meal. |
| 2 hours after eating | Below 140 mg/dL | This threshold comes from a standardized oral glucose tolerance test, not from one home or CGM reading. |
| 4 hours after eating | Usually back near baseline, commonly 70–99 mg/dL | No universal four-hour cutoff exists. What matters is whether it returned. |
| Mean 24-hour glucose | 99 ± 7 mg/dL in one healthy CGM cohort | A group average from research, not a target you have to match. |
| A1C | Below 5.7% | Below the ADA prediabetes cutoff, and it covers a longer window than any single reading. |
| Time in range | Median 96% between 70 and 140 mg/dL | A benchmark from a healthy CGM cohort, not a diagnostic criterion. |
Some of those figures carry diagnostic weight and some do not, which is worth knowing before you measure yourself against them. The fasting range, the two-hour result and the 5.7% A1C come from standardized laboratory testing. The rest describe what healthy people's sensors actually recorded. That is useful context, but it was never designed as a pass mark. Neither kind is a personal target, and neither a CGM nor a home meter can diagnose diabetes or prediabetes.
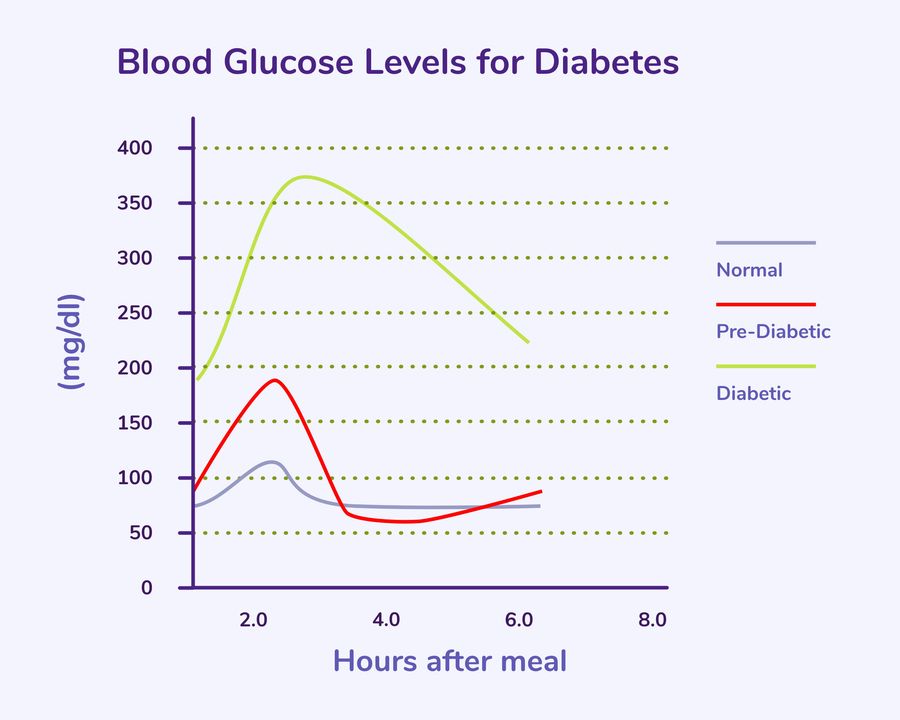
Is 86 blood sugar normal? What about 87, 89 or 104?
Readings in the 80s sit comfortably inside the usual fasting reference range. A fasting result of 86, 87 or 89 mg/dL is unremarkable on its own. None of them is a special target, and the small gaps between them carry no real meaning, since meters and sensors both have a margin of error wide enough to cover a few points.
104 mg/dL is the one people ask about most, and the answer depends entirely on when you took it. After a meal, 104 mg/dL is an ordinary reading. As a fasting laboratory result, 100–125 mg/dL falls in the prediabetes range, so a fasting 104 is worth mentioning to a healthcare professional, particularly if it shows up more than once. A single fasting value slightly over 100 does not establish prediabetes by itself, and diagnosis normally needs a repeat or confirmatory laboratory test.
The pattern holds for any number you are looking up. The value alone tells you very little until you add when you measured, what came before it and whether it repeats.
What is the average glucose level for a non-diabetic?
In a multicenter CGM study of healthy participants without diabetes, mean 24-hour sensor glucose was 99 ± 7 mg/dL. It came in around 98–99 mg/dL across most age groups, and 104 mg/dL among participants aged 60 and over. Other studies and other populations land on somewhat different figures.
What is estimated average glucose, and what is a normal range?
Estimated average glucose (eAG) is a conversion of your A1C into the same units as a meter reading, so a lab result becomes easier to compare with day-to-day numbers. An A1C below 5.7% works out to an eAG below roughly 117 mg/dL, while 6.0% is about 126 mg/dL and 7.0% about 154 mg/dL.
Worth knowing: eAG and the mean glucose your CGM reports are two different estimates covering two different windows, so they will not always agree. eAG is derived from two to three months of A1C. A CGM average reflects whatever period you selected in the app. If the two look far apart, this guide covers why GMI and lab A1C often do not match.
What is a normal time in range for a non-diabetic?
It depends which range you are measuring, which is why the number is meaningless without its limits. In the healthy CGM study above, participants spent a median 96% of the day between 70 and 140 mg/dL, and 89% between 70 and 120 mg/dL. Brief excursions above and below those bands still happened. These are research benchmarks rather than diagnostic criteria or treatment goals. For a different use of the same metric, see how time in range works after meals.
What is a normal blood sugar spike after eating for non-diabetics?
Rising after a meal is normal and expected. Glucose climbs as carbohydrates are digested, reaches a peak, then heads back toward where it started. How high and how fast depends on the amount and form of carbohydrate, the rest of the meal, and things like activity, sleep and stress.
Research in people without diabetes shows brief readings above 140 mg/dL do occur, even though most of the day is usually spent below that. So a single peak tells you less than the whole curve: where you started, how high it went, and how long it took to come back down.
Normal blood sugar 1 hour after eating for non-diabetics
No diagnostic one-hour cutoff exists for an ordinary meal in adults without diabetes, but research gives a reasonable expectation. CGM studies in healthy people found glucose peaked about 45 to 60 minutes after the first bite, at roughly 120 to 140 mg/dL depending on the meal. Breakfast tended to produce the highest peak of the day. The spread was wide, with the 10th to 90th percentile running from about 116 to 174 mg/dL.
So a one-hour reading somewhere in the 120s or 130s is typical. Higher happens, particularly after a large or fast-absorbing meal. The familiar 140 mg/dL figure belongs to the two-hour point of a standardized glucose tolerance test and was never a one-hour benchmark.
Normal blood sugar 2 hours after eating for non-diabetics
Below 140 mg/dL at two hours is considered normal during a standardized 75 g oral glucose tolerance test. An ordinary meal is not standardized, and a CGM is not a diagnostic device. One two-hour reading a little over 140 mg/dL does not establish prediabetes, though repeated unexpected readings are worth raising with a healthcare professional.
Do normal blood sugar levels differ for men and women?
The reference ranges above apply to nonpregnant adults regardless of sex. Fasting thresholds, the two-hour glucose tolerance test result and the 5.7% A1C threshold are not split by sex.
Pregnancy is the clear exception, with its own lower targets, covered in the next section. Individual factors such as age, medication, other health conditions and hormonal changes can all affect readings, but they do so person by person rather than through separate published ranges for men and women.
Ideal Blood Sugar Levels for People with Diabetes
If you have diabetes, talk to your care team about your own glucose goals. Targets shift with age, medication, insulin use, hypoglycemia risk, pregnancy and other health conditions.
For many nonpregnant adults, the 2026 American Diabetes Association Standards of Care give these general targets:
| Measurement | Adults with Type 1 diabetes | Adults with Type 2 diabetes | Gestational diabetes | Children with Type 1 diabetes* |
|---|---|---|---|---|
| Before meals / fasting | 80–130 mg/dL | 80–130 mg/dL | Below 95 mg/dL fasting | 70–144 mg/dL fasting and overnight |
| After meals | Below 180 mg/dL at 1–2 hours | Below 180 mg/dL at 1–2 hours | Below 140 mg/dL at 1 hour or below 120 mg/dL at 2 hours | Within 70–180 mg/dL |
| A1C | Often below 7% | Often below 7% | Individualized; often below 6% where safely achievable | Below 7% |
| Time in range | At least 70% at 70–180 mg/dL | At least 70% at 70–180 mg/dL | Individualized | At least 70% at 70–180 mg/dL, with under 4% below 70 mg/dL |
*The ADA individualizes pediatric glucose targets rather than publishing a single chart, so the children's column follows the ISPAD consensus guidelines, which do give numeric ranges. The A1C goal below 7% is common to both.
The ADA's general adult targets are the same for type 1 and type 2 diabetes. An individual plan can still be tighter or looser than the table. Pregnancy targets are lower and belong with the pregnancy care team. For children, a lower A1C goal of below 6.5% may suit those in the remission phase or using advanced insulin delivery with close support. Bedtime goals should be individualized as well, rather than lifted from a general chart.
For a fuller view of daily patterns, NICE offers a more specific type 1 framework: 90–126 mg/dL on waking, 72–126 mg/dL before other meals and 90–162 mg/dL at least 90 minutes after eating.
Glucose targets for older adults with diabetes
Targets often loosen with age and health status, mainly to reduce the risk of hypoglycemia. The ADA's 2026 guidance groups older adults by overall health rather than by age alone:
| Health status | A1C | Fasting / pre-meal | Bedtime |
|---|---|---|---|
| Healthy (few chronic illnesses, intact cognitive and functional status) | Below 7.0–7.5% | 80–130 mg/dL | 80–180 mg/dL |
| Complex / intermediate (multiple chronic illnesses, some cognitive or functional limitation) | Below 8.0% | 90–150 mg/dL | 100–180 mg/dL |
| Very complex / poor health (end-stage illness, severe cognitive impairment) | Avoid relying on A1C; focus on avoiding hypoglycemia and symptomatic hyperglycemia | 100–180 mg/dL | 110–200 mg/dL |
For CGM users, the same guidance suggests time in range of at least 70% with time below 70 mg/dL under 4% for healthy older adults, and at least 50% with time below 70 mg/dL under 1% for the complex group.
Why Your "Normal" May Look Different From the Chart
Say your CGM reads 148 mg/dL two hours after eating. That sits above the two-hour reference from a laboratory glucose tolerance test, and it is tempting to treat those eight points as a verdict. The number does not tell you what you ate, where you started, whether you counted two hours from the first bite, how the sensor behaved during a fast change, or whether you were back near baseline twenty minutes later.
It also does not know that you slept badly, or trained that morning, or had a rough week, or saw something completely different after the same meal on three other days. And an ordinary meal recorded by a CGM is simply not the standardized glucose drink used for diagnostic testing. The reading is a data point.
The reverse is true as well. A value sitting inside a broad reference range can still be unusual for you. Population ranges give you context. Repeated personal patterns are what give a number meaning.
How to Control Your Blood Sugar
A general chart cannot tell you how to adjust food, medication or insulin. What it can do is help you ask a sharper question about the number in front of you.
Fingerstick monitoring gives you one moment. A CGM samples the fluid under the skin at frequent intervals, which makes the direction and shape of a curve visible rather than inferred. If you are weighing up devices, this guide covers current CGM options and how they differ.
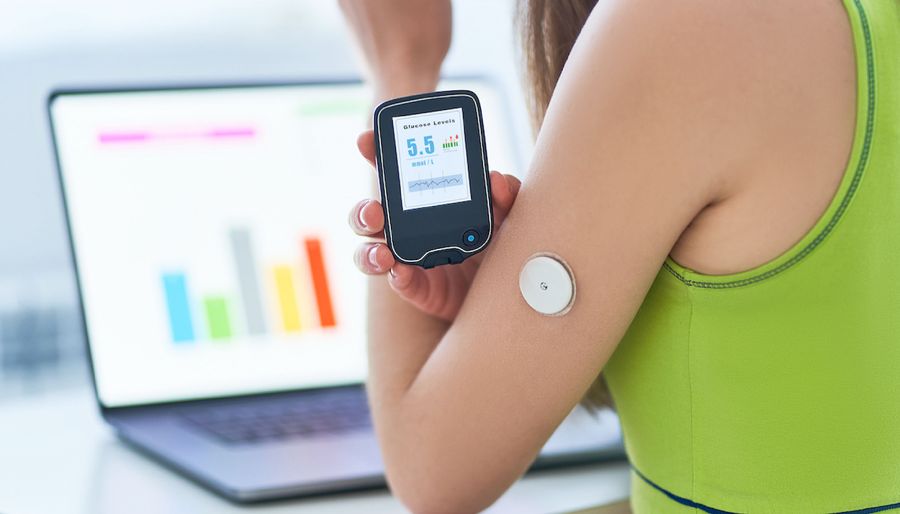
Whichever method you use, keep the timing consistent when you compare readings: fasting after at least eight hours without calories, immediately before a meal, or one to two hours after the first bite. Note the meal, the activity and anything unusual like poor sleep, stress or illness. One odd number can come down to timing, technique, sensor lag or just an odd day. A pattern across comparable days is far more useful, both to you and to your care team.
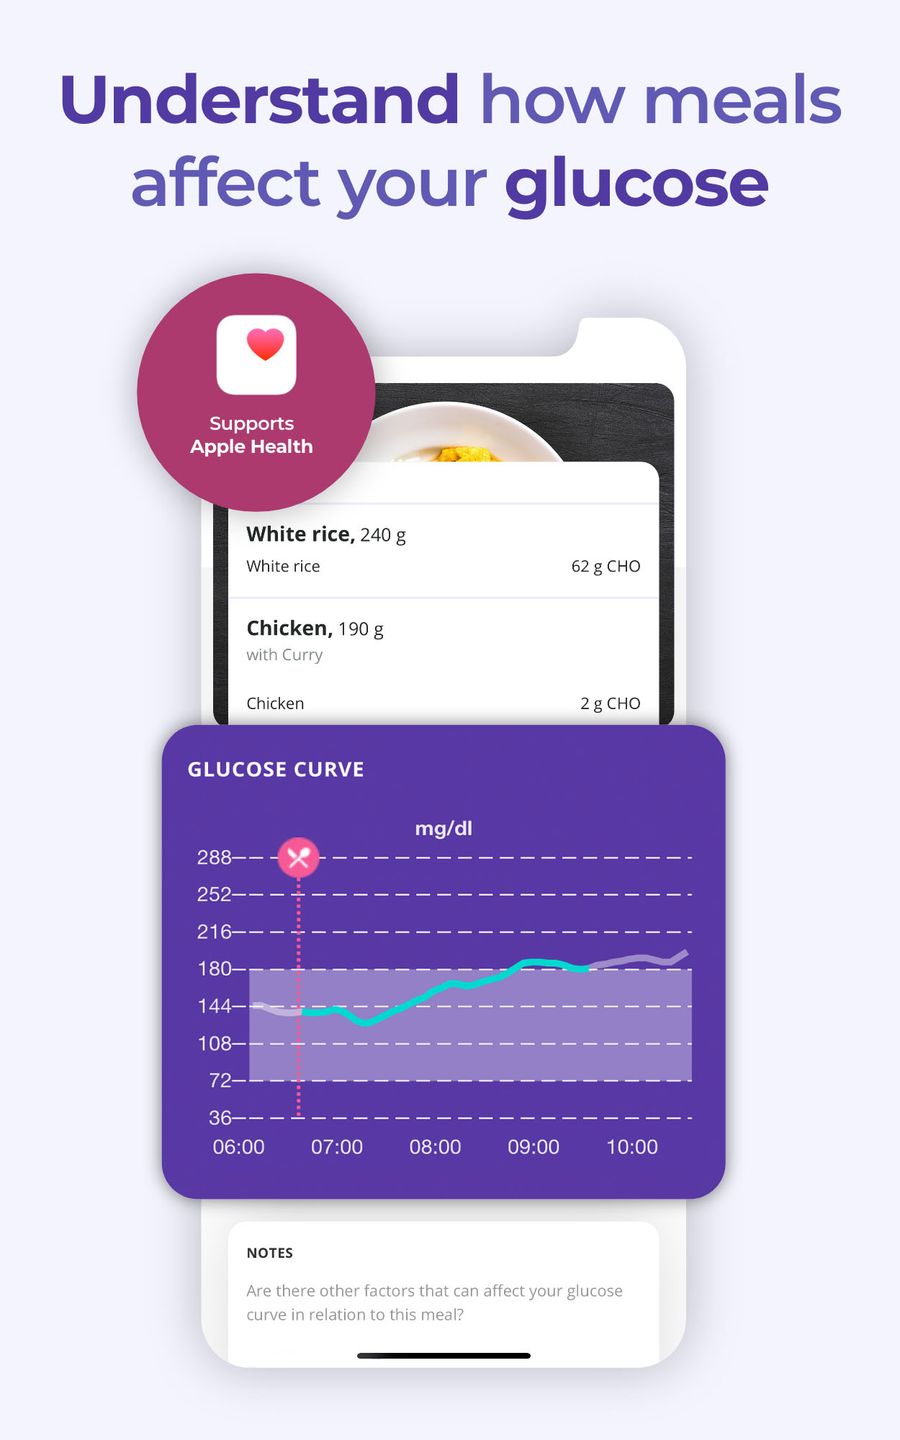
If you want to connect the readings to what you actually ate, SNAQ pairs meal photos with glucose data so you can compare how specific foods relate to your glucose curve across days instead of judging one isolated result.
Seek medical advice promptly for concerning symptoms, for repeated results outside your agreed range, or for suspected severe low or high glucose. Do not change medication or insulin based on a general article or chart.