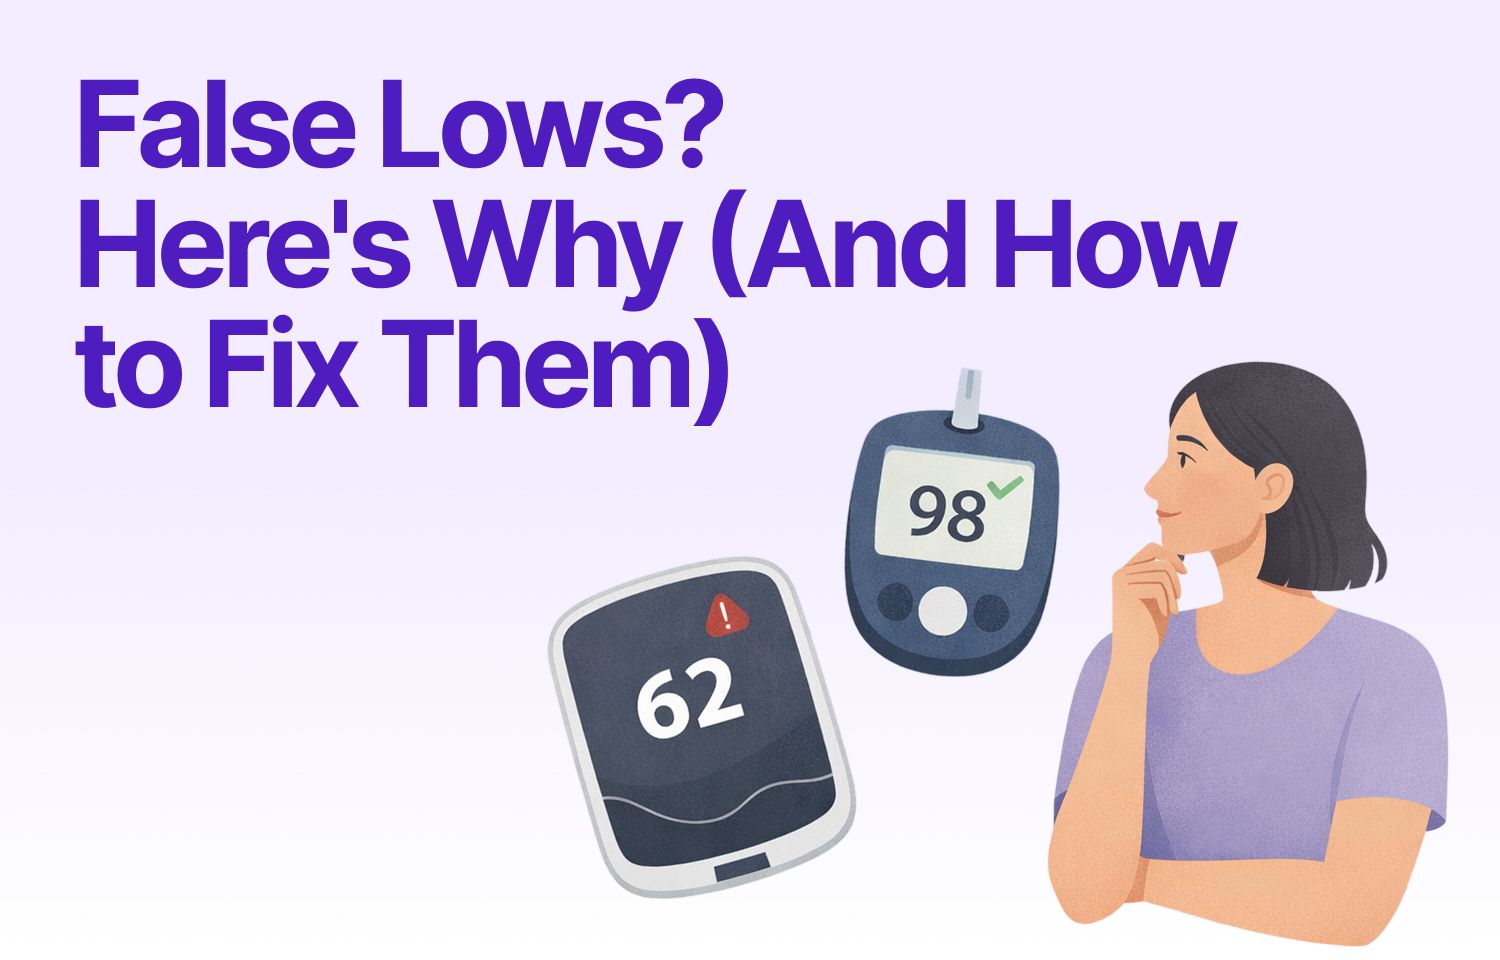
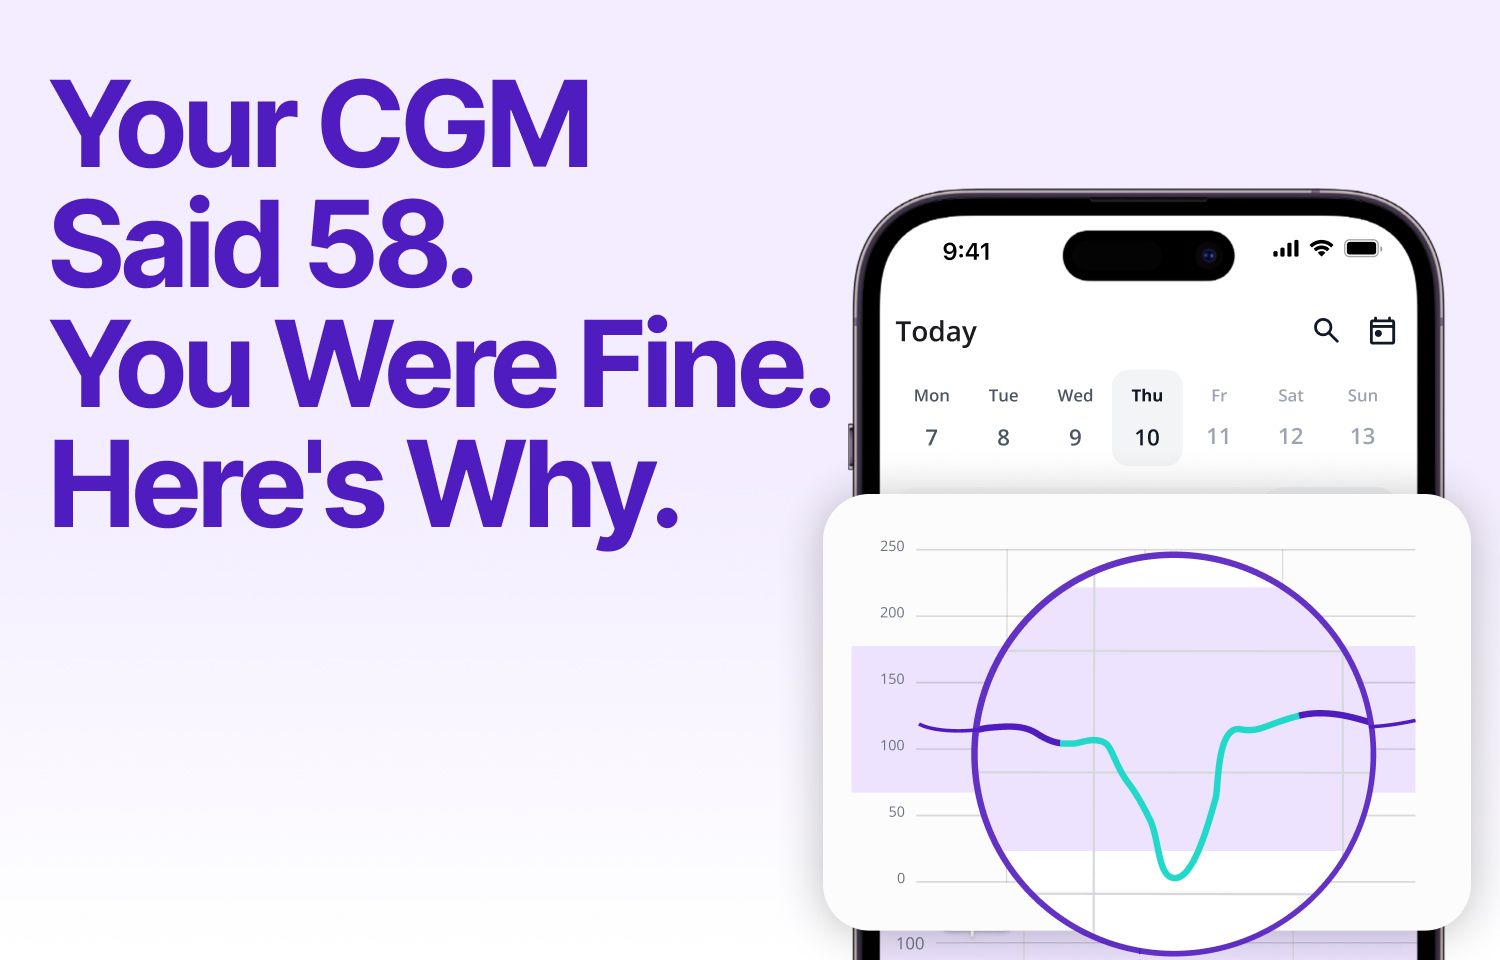
Quick answer: A compression low is a false low glucose reading caused by physical pressure on your CGM sensor, most often while you sleep on it. On your graph it forms a sharp V-shape: a fast drop and an equally fast recovery within 10 to 20 minutes, usually with no symptoms of a real low.
You wake up at 2 AM to a low glucose alarm. You check your CGM: 58 mg/dL. Heart racing, you reach for juice.
Ten minutes later, it reads 115 mg/dL. You never felt low. The juice hasn't even kicked in yet.
What happened? Most likely a compression low. Your sensor was pressed against your body while you slept, and the pressure temporarily distorted the reading. Once you shifted position, the number snapped back to normal.
This guide will help you recognize that pattern in seconds.
What Causes a Compression Low
CGM sensors don't measure glucose directly from your blood. They read it from interstitial fluid, the thin layer of fluid that sits between your cells just beneath the skin. When sustained pressure is applied to the sensor site, the volume of that fluid in the area temporarily decreases. Less fluid means less glucose for the sensor to detect, which produces a falsely low reading.
The false reading itself isn't dangerous. The real risk is indirect: treating a number that isn't real, which can push your glucose higher than it needs to go.
The V-Shape: Your Visual Clue
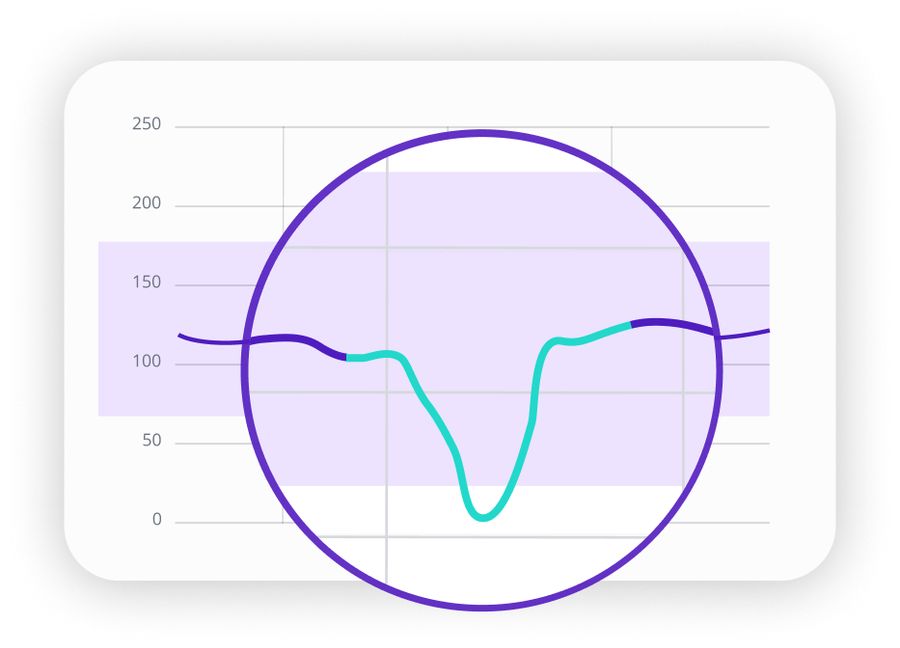
On your CGM graph, a compression low creates a distinctive pattern. The glucose line drops sharply over 10 to 20 minutes, bottoms out, then climbs back up just as sharply. The whole event forms a V. No lingering low. No gradual recovery.
Where Compression Lows Happen Most
Sleep is the most common scenario. Side sleepers often compress sensors on the upper arm; stomach sleepers on the abdomen. Even a small position shift that traps your arm under your pillow can be enough.
Tight clothing is another regular culprit. Jeans, belts, or shapewear pressing against an abdominal sensor can create enough sustained pressure to produce a false low.
Everyday positions also contribute more than people expect. Leaning your arm against a desk while typing, pressing back into a car seat, or carrying a shoulder bag across the sensor site can all trigger a temporary dip.
During exercise, backpack straps or a weightlifting belt sitting over the sensor site may cause a dip mid-workout or right after. If you see a sharp V-shape and had equipment contact at that time, that's your first clue.
Compression Low vs. True Low: How to Tell Them Apart
The most reliable signal is how you feel. A reading of 58 mg/dL with no symptoms is a very different situation from 58 mg/dL with shakiness and sweating. The table below captures the key differences. When you're unsure which you're dealing with, a fingerstick takes ten seconds and removes the guesswork.
| Characteristic | Compression Low | True Low |
|---|---|---|
| Graph shape | Sharp V: rapid drop and rapid recovery | Gradual descent, plateau, slow recovery |
| Duration | 15 to 30 minutes total | Often 45 minutes or more |
| How you feel | No symptoms | Shakiness, sweating, confusion |
| Timing | Often during sleep or rest, with an obvious pressure source | Can happen at any time, often related to activity, meals, or medications |
| Recovery | Resolves on its own once pressure is removed | Requires attention and may need follow-up with your care team |
How to Minimize Compression Lows
Site selection is the most effective starting point. If you tend to sleep on one side, place your sensor on the opposite arm. If tight waistbands are part of your daily routine, an upper arm site avoids that problem entirely. Small adjustments in placement often resolve a pattern of repeated false lows more reliably than anything else.
Rotating sensor sites with each replacement also helps. Over time you'll learn which spots work best for your sleeping position, your clothing habits, and your daily routine.
If overnight alarms are a recurring issue, a small pillow supporting your sensor arm, or a shift toward sleeping on your back, can reduce the frequency significantly.
For a broader look at what else can affect your sensor's accuracy, see our guide on CGM accuracy factors.
Real-World Scenarios
Scenario 1: The Midnight Alarm
You wake to a 62 mg/dL alert. You'd been lying on your sensor arm. The dip started 15 minutes ago and is already climbing back up on its own. You shift position and wait. Five minutes later, the CGM reads 95 mg/dL. No juice needed.
Scenario 2: Post-Lunch Drop at Your Desk
An hour after lunch, your CGM drops to 65 mg/dL. You feel fine. You notice you've been pressing your arm against the desk while typing. You shift position, wait a few minutes, and the reading climbs back to 110 mg/dL on its own.
Scenario 3: Post-Workout Dip
Your CGM drops to 58 mg/dL right after lifting weights. You felt fine throughout the session. The graph shows a sharp V, and your belt had been sitting directly over the sensor site. A fingerstick confirms your glucose is actually 102 mg/dL.
For more on how activity shapes your glucose curve, see immediate vs delayed spikes and curve shapes.
When It's Not a Compression Low
Not every sharp dip is a sensor artifact. Some true glucose drops happen quickly, especially during physical activity or after a long gap without eating. Here are the signs to take a dip seriously, regardless of the graph shape:
- You feel symptoms. Shakiness, sweating, confusion, or a rapid heartbeat matter more than the shape on the graph.
- The low doesn't resolve. If glucose stays down for 30 or more minutes without any change in body position or pressure, it is more likely real.
- It happened during or after exercise. Physical activity can drive glucose down fast. A steep drop mid-run is more likely real than pressure-related.
- You haven't eaten in several hours. A long fasting gap raises the chance of a true low, especially if you take certain medications.
How SNAQ Helps You Spot Patterns
Catching a single compression low in the moment is useful. Noticing that it happens every Tuesday after your gym session, or every night you sleep on your left side, is what actually helps you fix it.
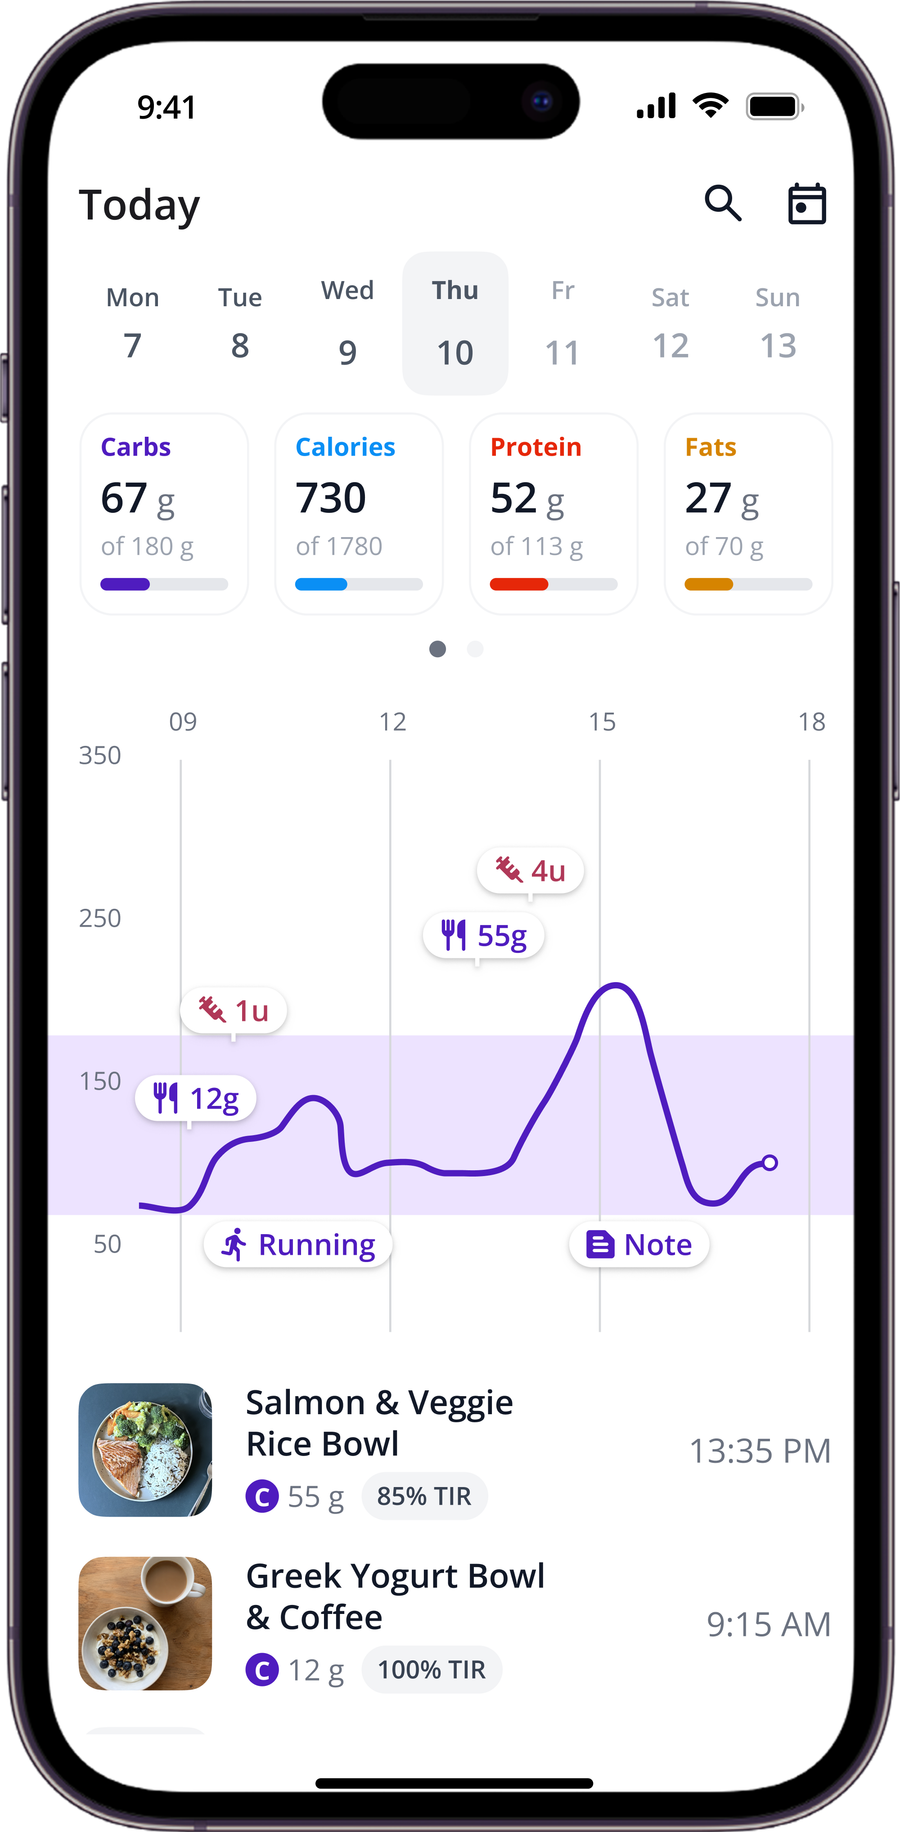
SNAQ integrates with your CGM and overlays your meals, activities, and notes directly on your glucose graph. When you spot a V-shape, you can immediately check what was happening at that time. Insights surfaces recurring patterns in your weekly and monthly reports, so repeated false lows at consistent times stop catching you off guard.
The AI Coach can help you make sense of unusual graph shapes when the context isn't obvious. You can ask whether a dip was more likely from pressure or another cause, and get educational context based on your own data.
Note: SNAQ is a tool to support learning, not a substitute for clinical advice.
Putting It All Together
Compression lows are common, harmless, and recognizable once you know what to look for. The V-shape is your shortcut: a sharp drop, a quick recovery, no symptoms, and a plausible source of pressure nearby. Over time, spotting them builds genuine confidence in your data, so a 2 AM alarm stops feeling like a crisis.
If you want an easier way to connect those patterns to your daily habits, download SNAQ to overlay your meals and activities directly on your glucose graph.